The September 2018 Housing Market Statistics for Caledon, Ontario have been published. The statistics are compiled from data posted on the Toronto Real Estate Board.
Here are a few highlights from the analysis:
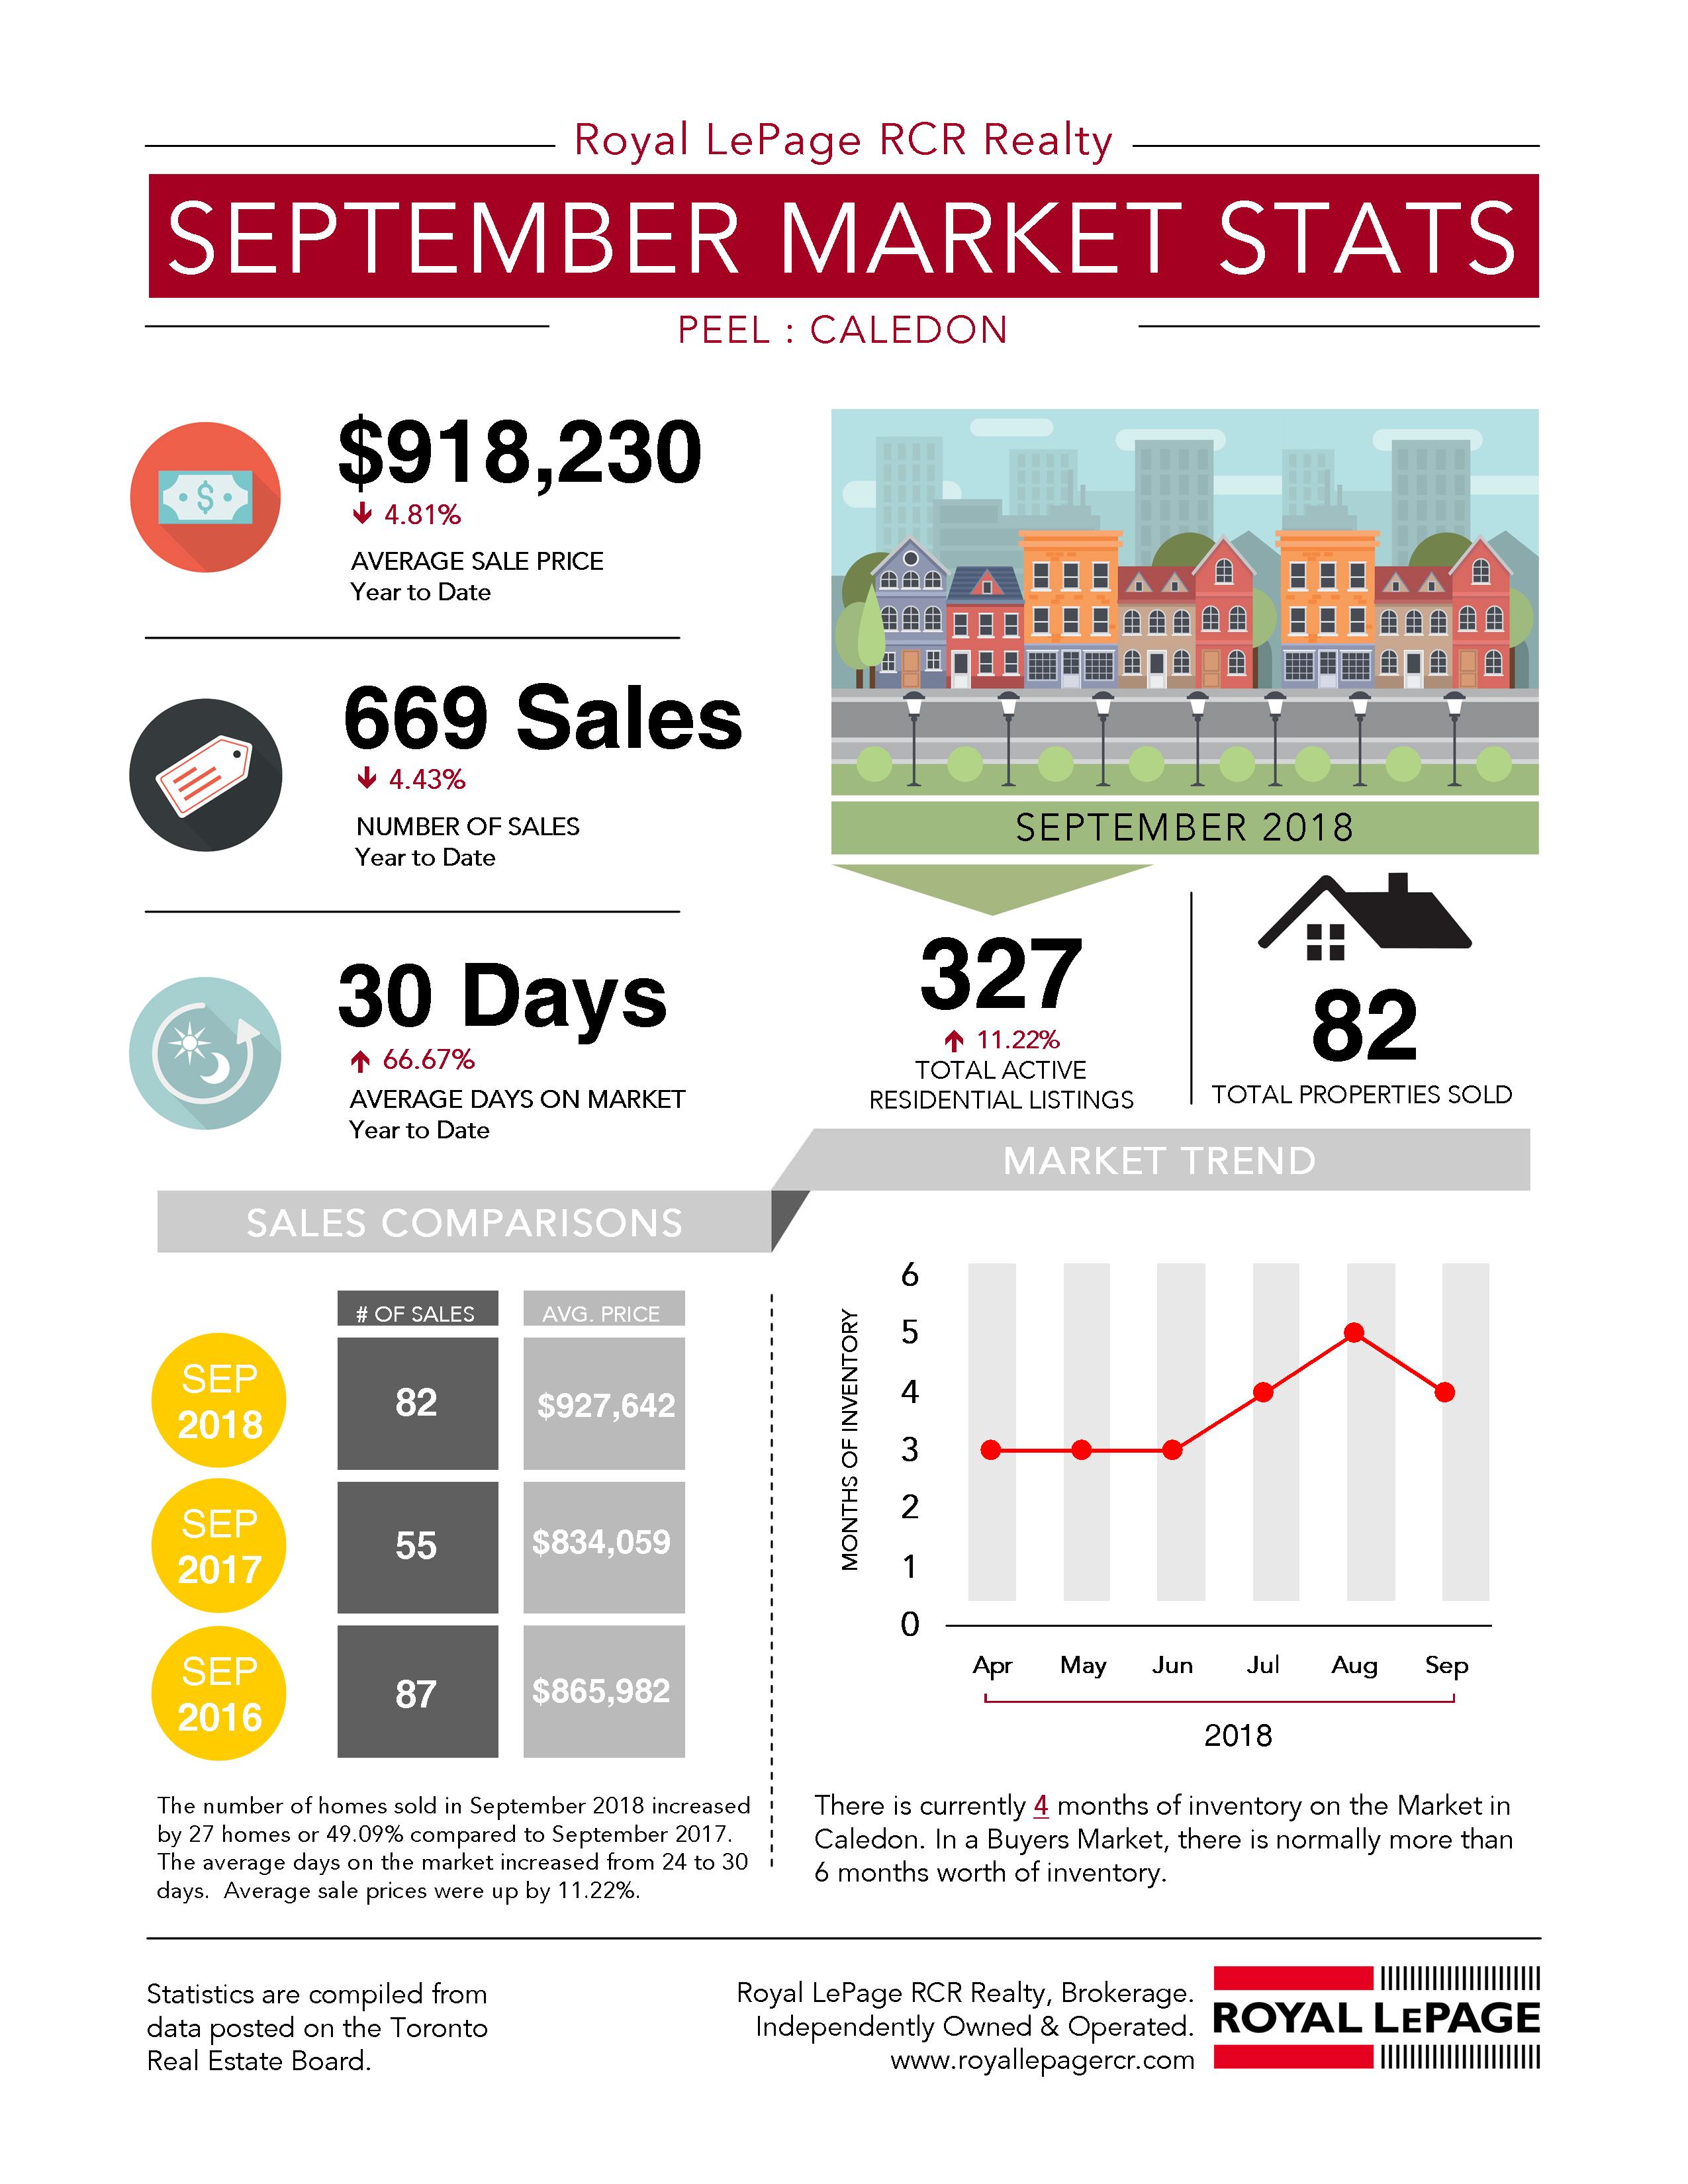
– The average sale price (year to date) is $918,230, that is a decrease of 4.81%.
– There were 82 properties sold in the month of September with a year to date total of 669 which is a decrease of 4.43% year to date.
– The average days on the market (year to date) is 30 days.
– The total active number of residential listings was 327 which is a slight increase of 11.22% in September 2018.
Download a PDF version here:
Peel – September 2018 Market Statistics for Caledon in Peel Region
Sales Comparisons: September 2018 to September 2016
The number of homes sold in September 2018 increased by 27 homes or 49.09% compared to September 2017. The average days on the market increased from 24 to 30 days. Average sale prices were down by 11.02%. Refer to the Sales Comparisons section on the infographic above.
Market Trend: April 2018 to September 2018
There is currently 4 months of inventory on the market in Caledon. In a buyers market, there is normally more than 6 months of inventory. Refer to the Market Trend section on the infographic above.
Source: The statistics are compiled from data posted on the Toronto real estate board.
View historical data for:
If you are thinking of buying or selling in Caledon or surrounding area, contact us today.
Jeff Belisowski | Sales Representative
jbelisowski@royallepage.ca
Office: 905-857-0651 | Cell: 647-992-6262

Not intended to solicit properties currently listed for sale or buyers under contract.