
The Toronto Real Estate Board (TREB) has published the October 2019 Housing Market Statistics. Here are some highlights from Caledon, Toronto West, and Simcoe.
Peel: Caledon Market Market Statistics
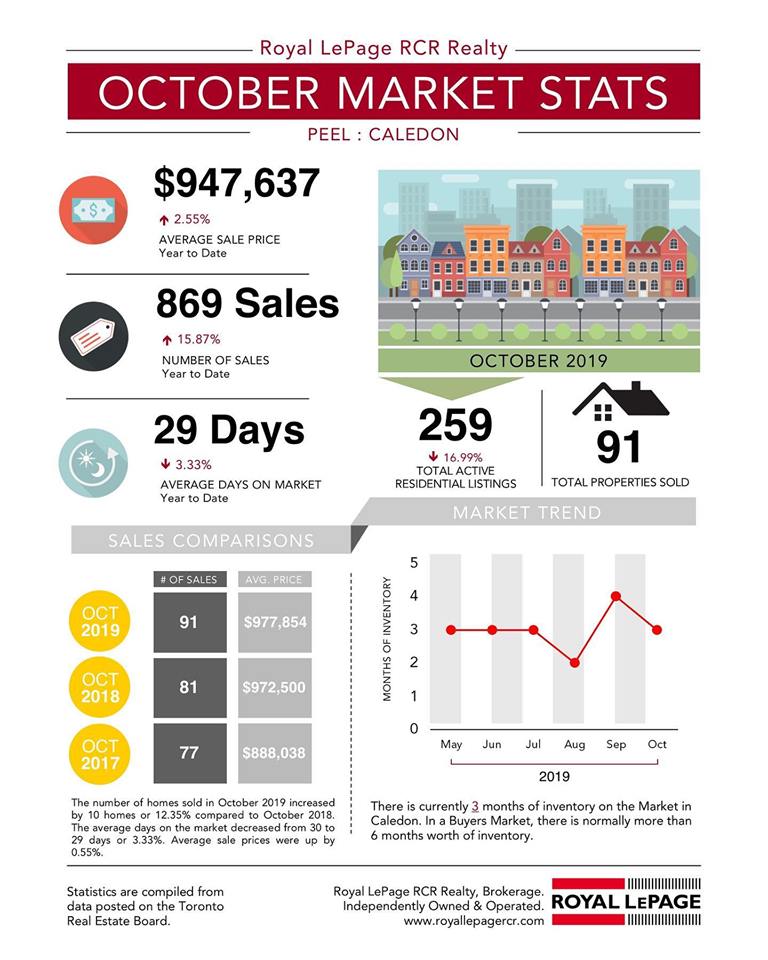
Contact me to chat about the statistics. Jeff
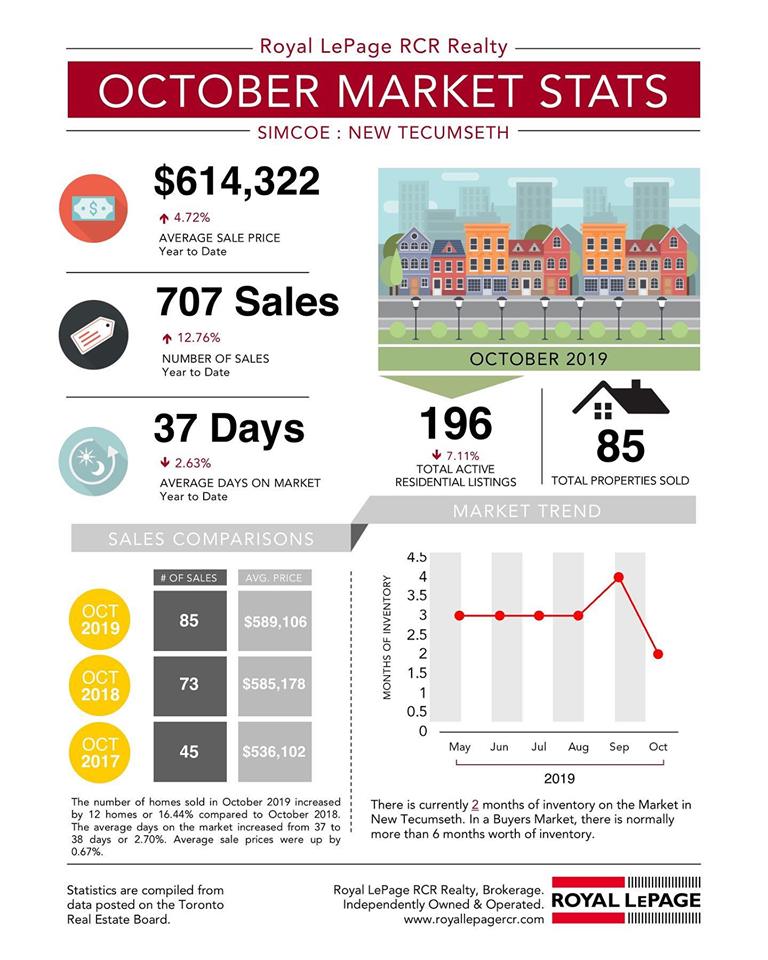
New Tecumseth Market Statistics
TREB has published the market statistics for October 2019 – here are the New Tecumseth numbers:
Toronto West Market Statistics
October 2019 Market stats are out for the Toronto West area, here is a great infographic summarizing some key data points:
📈 The average sale price year to date is $805,275 that is up by 5.69%.
📈 The number of sales year to date is up 9.63% to 7,693.
📈 The average days on the market is 20 days down by 4.76%.
📈 The total active listings is 1,275 down by 15.17%.
📈 The total number of properties sold in October 2019 was 883.
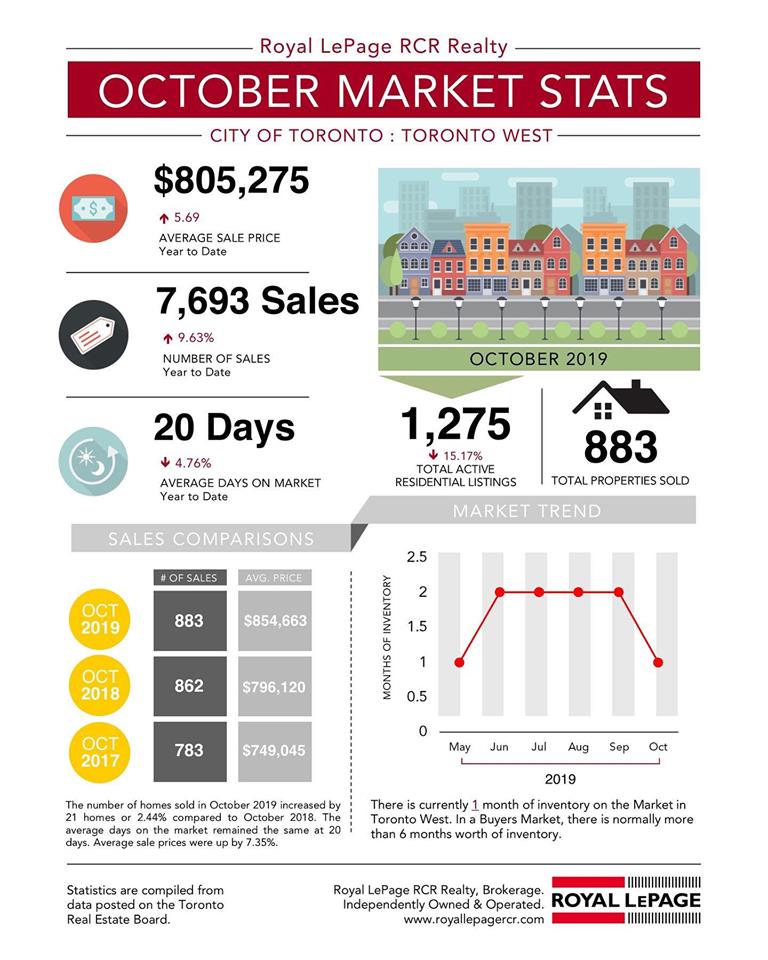
Note: Statistics are compiled from data posted on the Toronto Real Estate Board (TREB).
If you are looking to buy property in Toronto West, please call me to get a list of properties available.
Jeff Belisowski
Sales Representative
iPro Realty Ltd., Brokerage
Cell: 647-992-6262
Email: jeff@jeffbelisowskicom.staging.wpmudev.host
Website: www.jeffbelisowski.com
Not intended to solicit properties currently listed for sale or buyers under contract.
View historical data for:
- September 2019
- August 2019
- July 2019
- June 2019
- May 2019
- April 2019
- March 2019
- February 2019
- January 2019
- December 2018
- November 2018
- October 2018
- September 2018
- August 2018
- July 2018
- June 2018
- April 2018
- March 2018
- February 2018
- January 2018
- December 2017
If you have any questions about the market statistics or want to discuss your real estate needs, please call me to chat.
Jeff Belisowski
Sales Representative
iPro Realty Ltd., Brokerage
Cell: 647-992-6262
Email: jeff@jeffbelisowskicom.staging.wpmudev.host
Website: www.jeffbelisowski.com
Not intended to solicit properties currently listed for sale or buyers under contract.
#realestate #realestatetips #realestateadvice
#realestatebolton #bolton #caledon