
The October 2018 Housing Market Statistics for Caledon, Ontario have been published. The statistics are compiled from data posted on the Toronto Real Estate Board.
Here are a few highlights from the analysis:
– The average sale price (year to date) is $924,091, that is a decrease of 3.19%.
– There were 81 properties sold in the month of October with a year to date total of 750 which is a decrease of 3.23% year to date.
– The average days on the market (year to date) is 30 days.
– The total active number of residential listings was 312 which is an increase of 10.64% in October 2018.
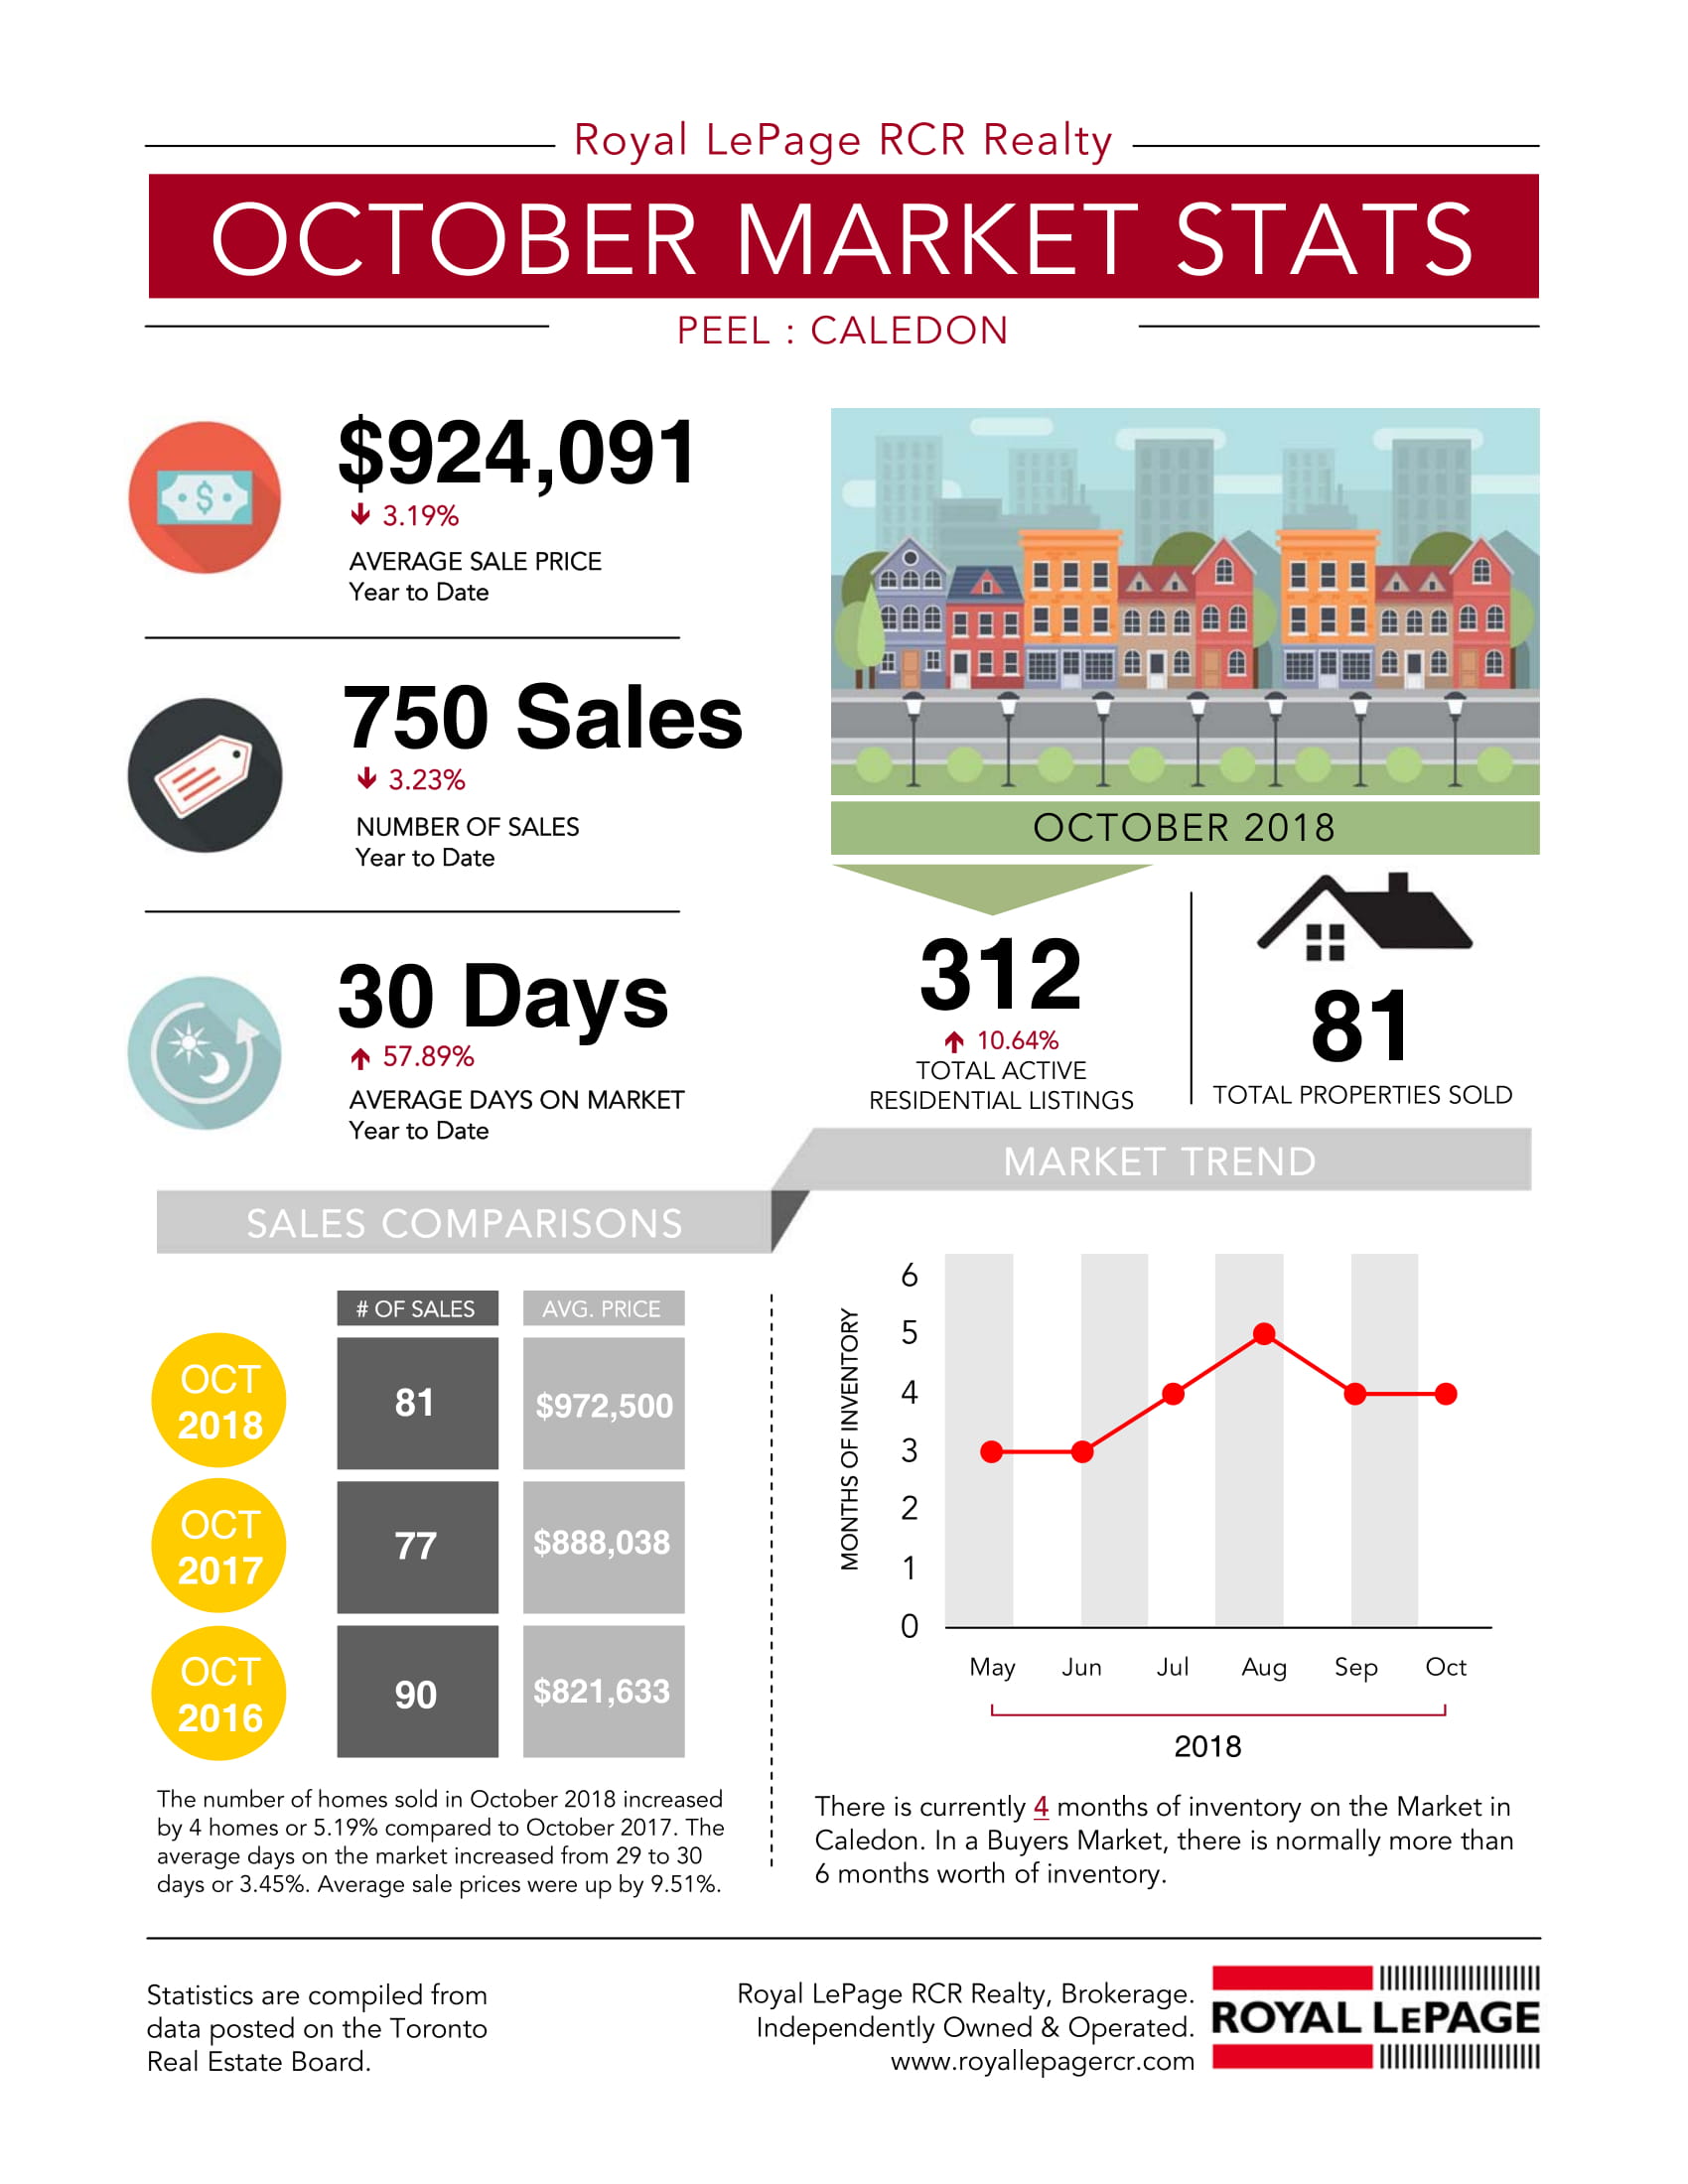
Sales Comparisons: October 2018 to October 2016
The number of homes sold in October 2018 increased by 4 homes or 5.19% compared to October 2017. The average days on the market increased from 29 to 30 days. Average sale prices were up by 9.51%. Refer to the Sales Comparisons section on the infographic above.
Market Trend: May 2018 to October 2018
There is currently 4 months of inventory on the market in Caledon. In a buyers market, there is normally more than x months of inventory. In a Buyers Market, there is normally more than 6 months worth of inventory. Refer to the Market Trend section on the infographic above.
Source: The statistics are compiled from data posted on the Toronto real estate board.
View historical data for:
- September 2018
- August 2018
- July 2018
- June 2018
- April 2018
- March 2018
- February 2018
- January 2018
- December 2017
If you are thinking of buying or selling in Caledon or surrounding area, contact us today.
Jeff Belisowski | Sales Representative
jbelisowski@royallepage.ca
Office: 905-857-0651 | Cell: 647-992-6262

Not intended to solicit properties currently listed for sale or buyers under contract.