The March 2018 Housing Market Statistics for Caledon, Ontario have been published. The statistics are compiled from data posted on the Toronto Real Estate Board.
Here are a few highlights from the analysis:
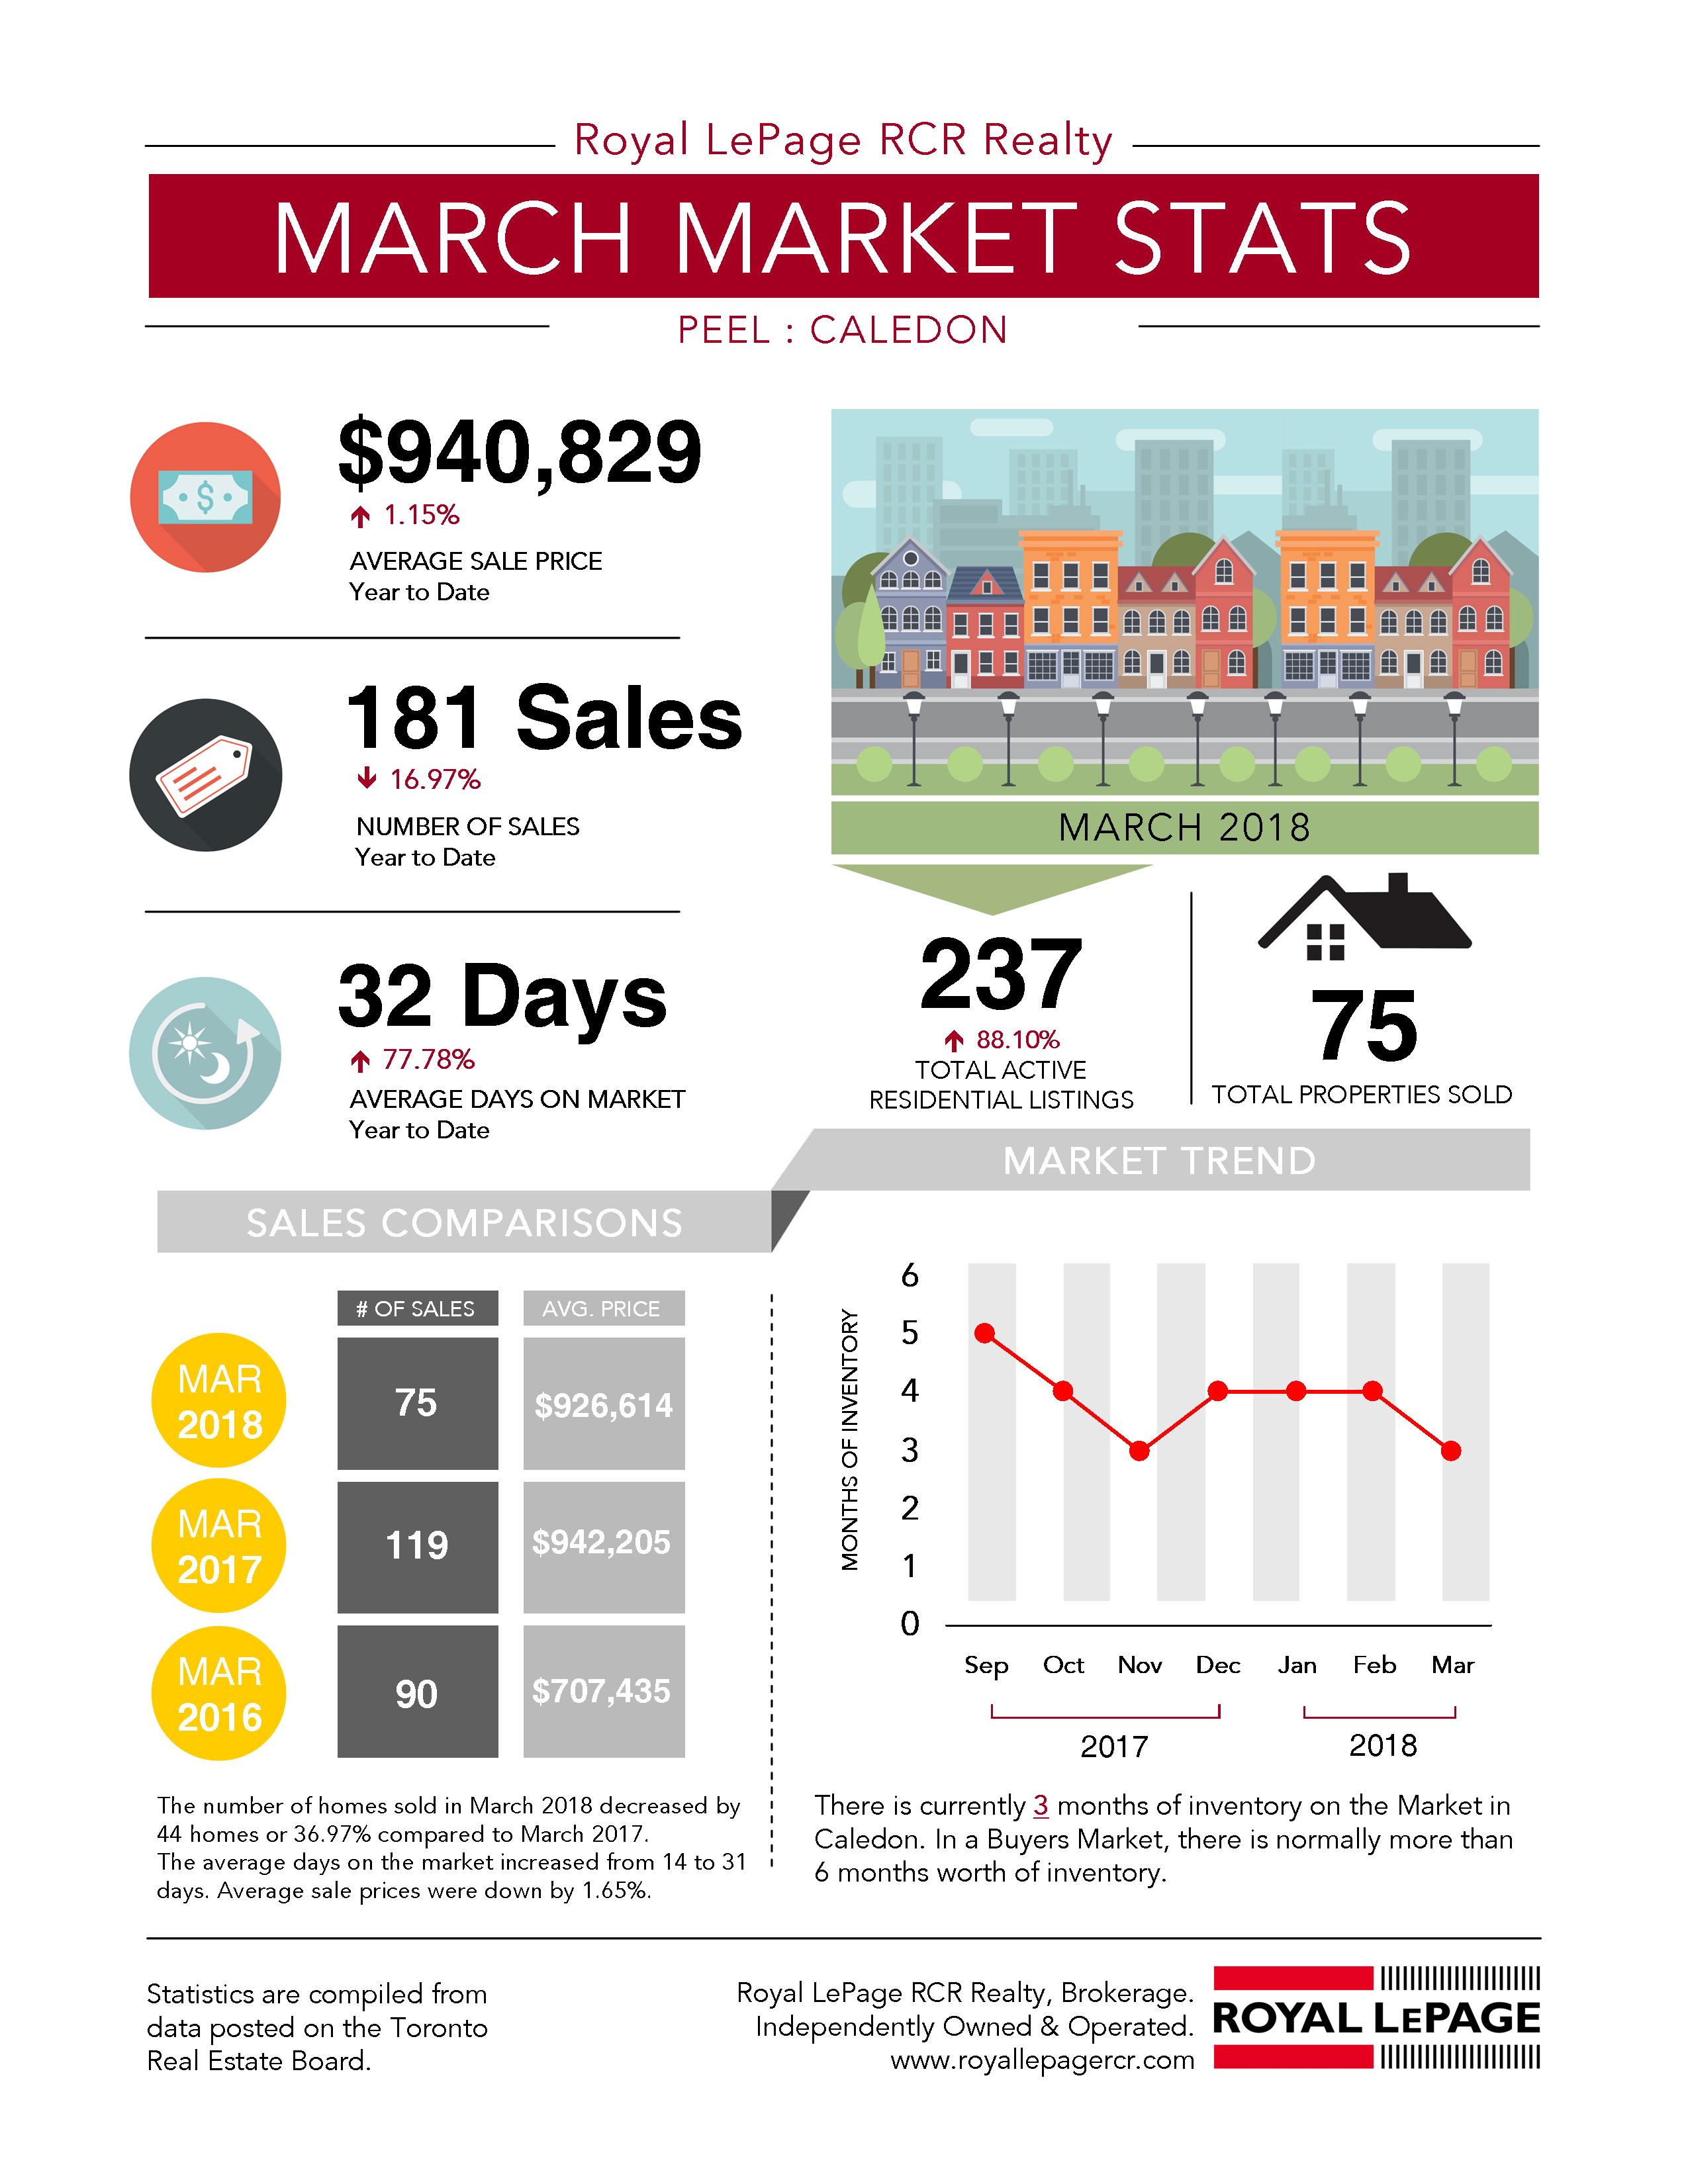
– The average sale price (year to date) is $940, 829, that has increased by 1.15%.
– There were 75 sales in the month of March with the average sale price being $926,614.
– The average days on the market (year to date) is 32 days.
– The total active number of residential listings went up (by 88.10%) in March 2018 to 237 listings.
– The total number of sales (year to date) is 181.
Click to download a PDF version: March 2018 Housing Market Statistics for Caledon, Ontario
Sales Comparisons: March 2018 to March 2016
The number of homes sold in March 2018 decreased by 44 homes or 36.97% compared to March 2017. The average days on the market increased from 14 to 31 days. Average sale prices were down by 1.65%. Refer to the Sales Comparisons section on the infographic above.
Market Trend: September 2017 to March 2018
There is currently 3 months of inventory on the market in Caledon. In a buyers market, there is normally more than 6 months of inventory. Refer to the Market Trend section on the infographic below.
Source: The statistics are compiled from data posted on the Toronto real estate board.
View historical data for:
If you are thinking of buying or selling in Caledon, please call me.
Jeff Belisowski
jbelisowski@royallepage.ca
Office: 905-857-0651
Cell: 647-992-6262
Not intended to solicit properties currently listed for sale or buyers under contract.