
The January 2018 Housing Market Statistics for Caledon, Ontario have just been published. The statistics are compiled from data posted on the Toronto Real Estate Board.
I wanted to share a few stats with you:
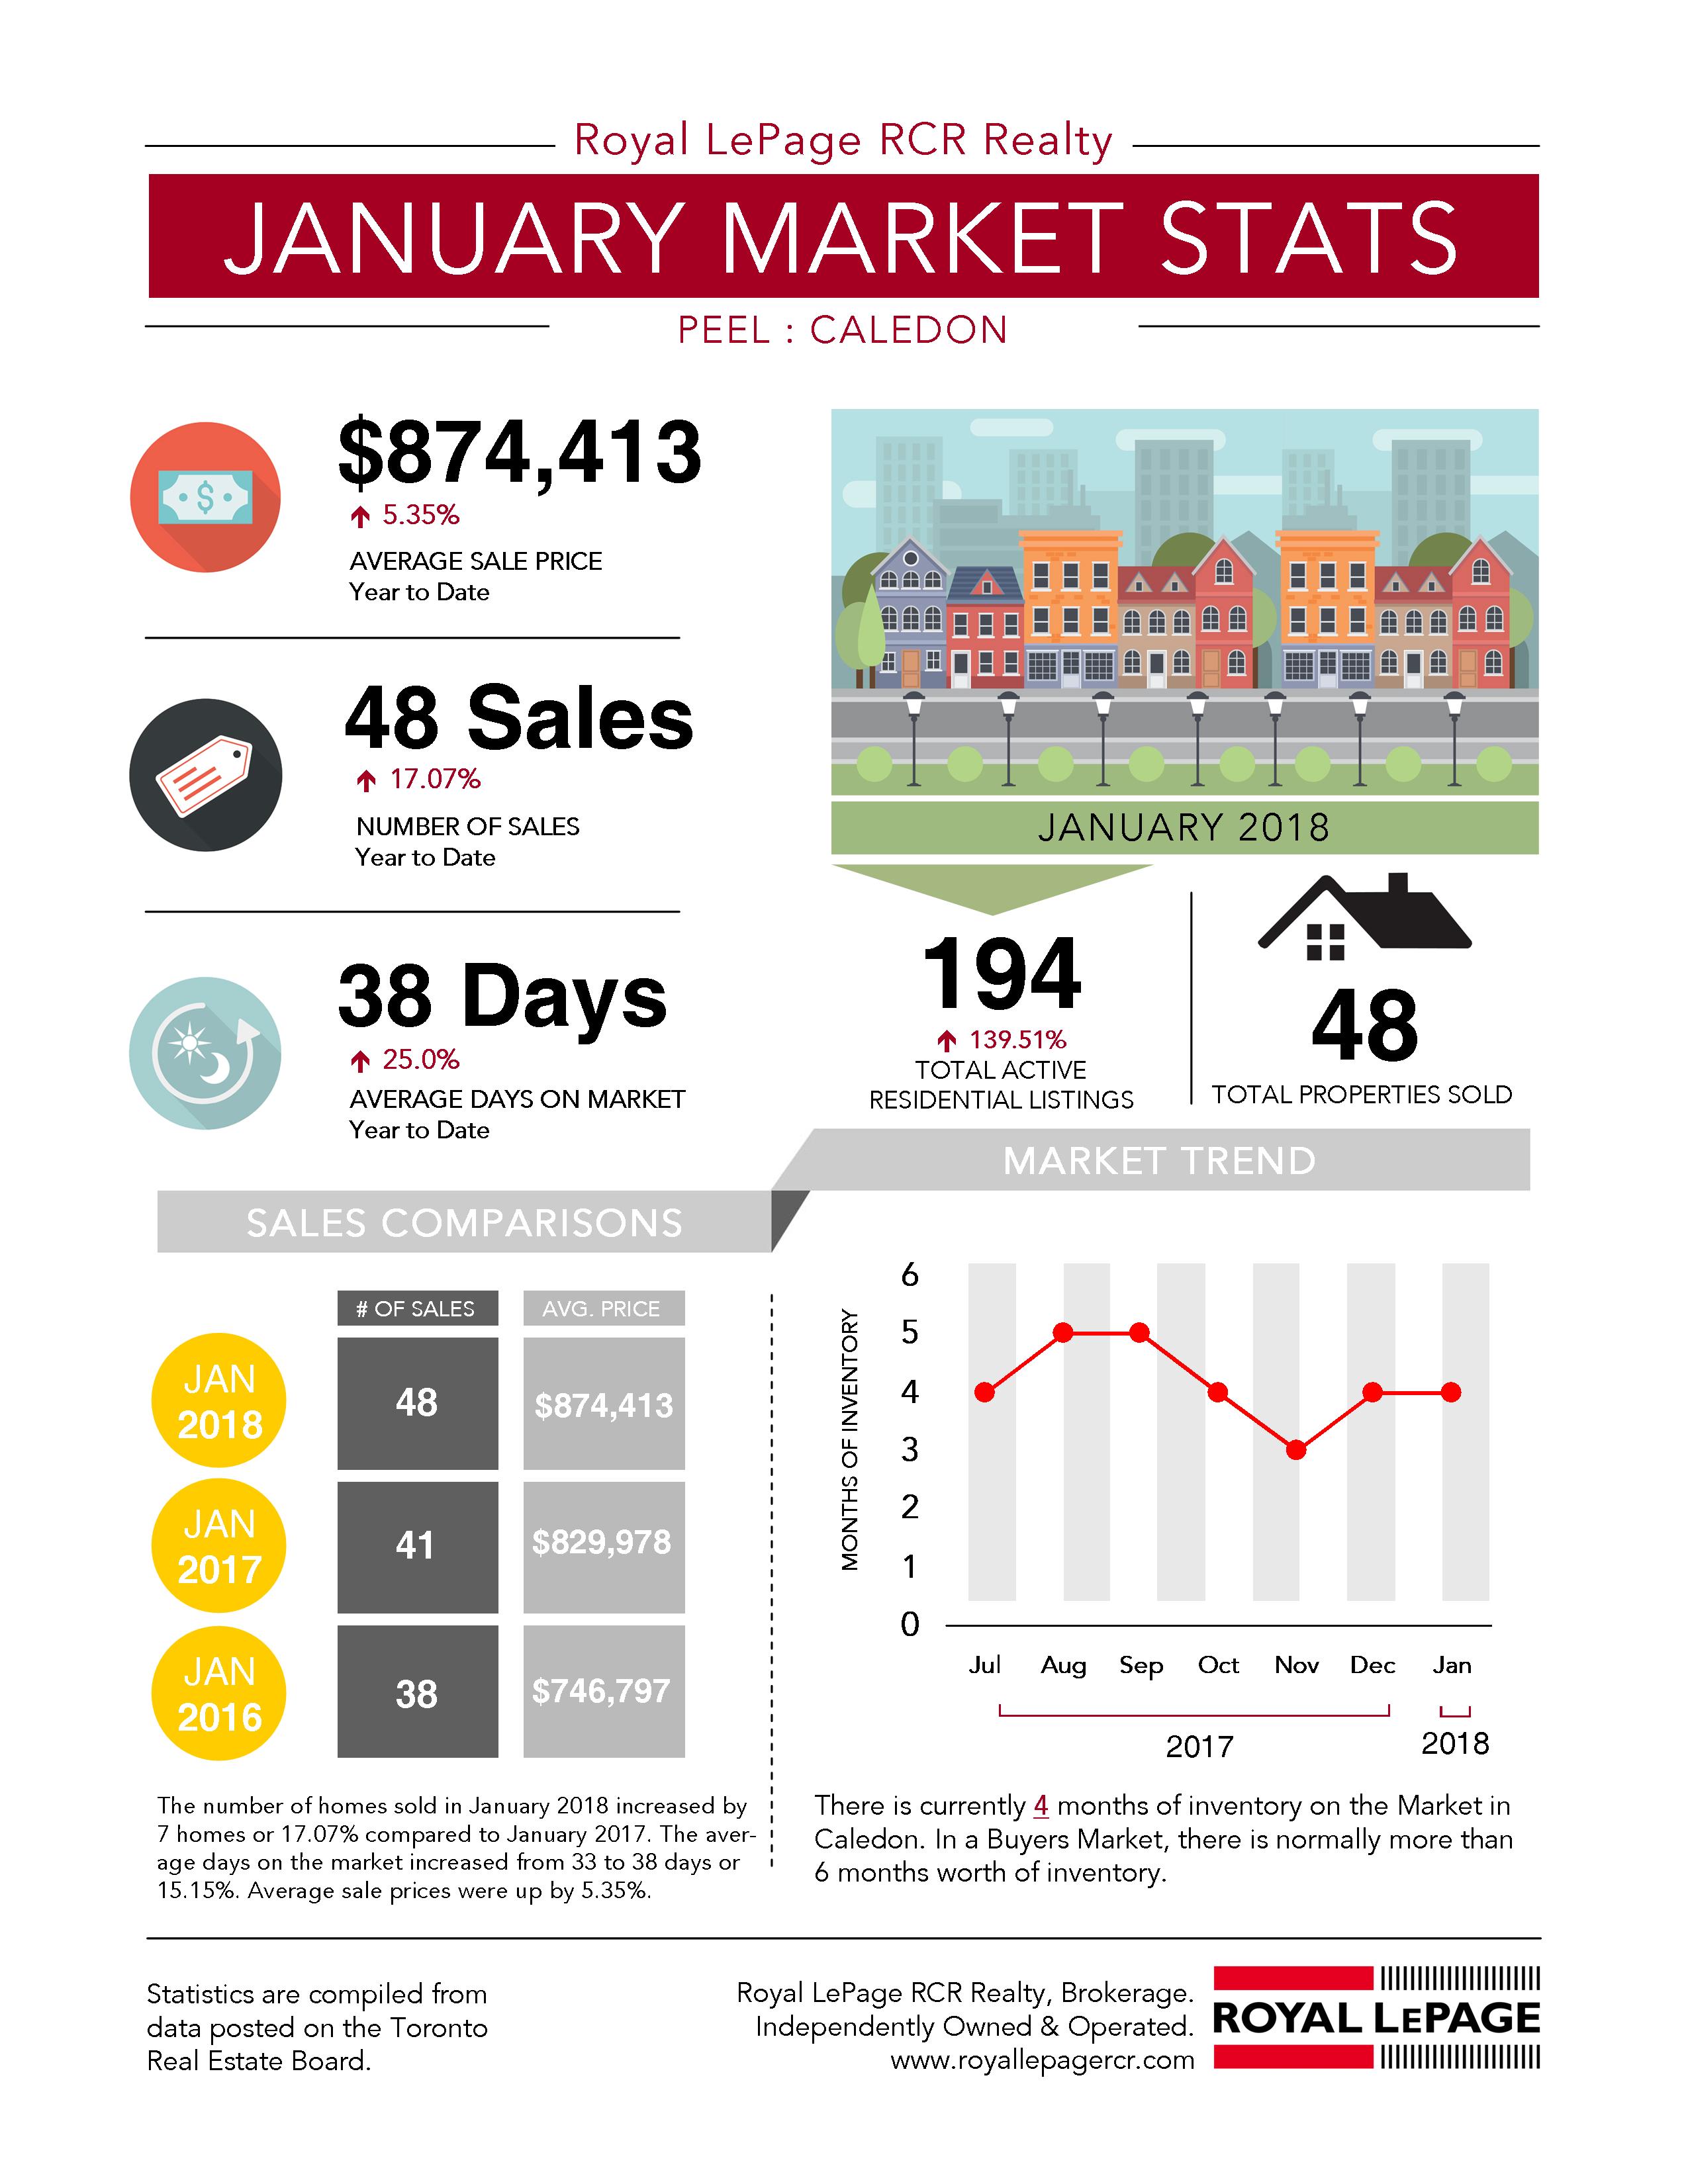
– The average sale price (year to date) has increased by 5.35%
– There were 48 sales in the month of January with 194 total active residential listings.
– The average days on the market (year to date) is 38 days
– The total active number of residential listings went up (by 139%) in January 2018 to 194 listings.
– The total number of properties sold was 48.
Sales Comparisons: January 2018 to January 2016
The number of homes sold in January 2018 increased by 7 homes or 17.07% compared to January 2017. The average days on the market increased from 33 to 38 days or 15.15%. Average sale prices were up by 5.35%. Refer to the Sales Comparisons section on the infographic below.
Market Trend: July 2017 to January 2018
There is currently 4 months of inventory on the market in Caledon. In a buyers market, there is normally more than six months of inventory. Refer to the Market Trend section on the infographic below.
Source: The statistics are compiled from data posted on the Toronto real estate board.
View historical data for December 2017.
If you are thinking of buying or selling in Caledon, please call me.
Jeff Belisowski
jbelisowski@royallepage.ca
Office: 905-857-0651
Cell: 647-992-6262
Not intended to solicit properties currently listed for sale or buyers under contract.