The Toronto Real Estate Board (TREB) has published the August 2019 Housing Market Statistics. From the compiled data posted I would like to show you some highlights from Caledon, Toronto West, and Simcoe.
Peel: Caledon Market Market Statistics
August 2019 vs. August 2018

Year to Date 2019 vs. Year to Date 2018
The number of homes listed in Caledon, year-to-date increased from 1,294 to 1,424, which is an increase of 10.05%. The number of homes sold increased by 115 homes or 19.56%. The average days on the market remained the same at 30 days. Average sale prices were up by 1.92%.
Contact me to chat about the statistics. Jeff
Toronto West Market Statistics
August 2019 Market stats are out for the Toronto West area, here is a great infographic summarizing some key data points:
📈 The average sale price year to date is $793,732 that is up by 5.57%.
📈 The number of sales year to date is up 8.89% to 5,978.
📈 The average days on the market is 20 days down by 4.76%.
📈 The total active listings is 1,156 down by 4.46%.
📈 The total number of properties sold in August 2019 was 670.
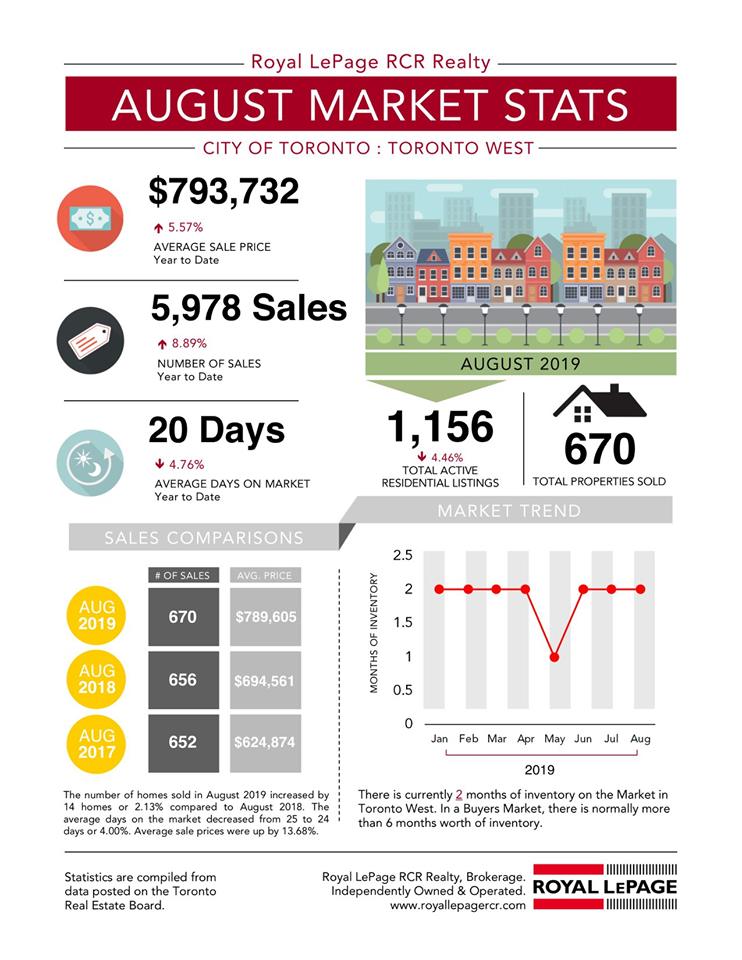
Note: Statistics are compiled from data posted on the Toronto Real Estate Board (TREB).
If you are looking to buy property in Toronto West, please call me to get a list of properties available.
New Tecumseth Market Statistics
TREB has published the market statistics for June 2019 – here are the New Tecumseth numbers:
August 2019 vs. August 2018
The number of active listings in New Tecumseth decreased from 232 to 219 homes or 5.60% in August 2019 over the same month in 2018. 4 more listings came on the Toronto Real Estate Board in August 2019 vs. August 2018 which is an increase of 3.15%. The number of homes sold increased by 9 homes or 13.43%. The average days on the market decreased by 8 days, from 40 days to 32 days. Average sale prices were up by 9.39%.
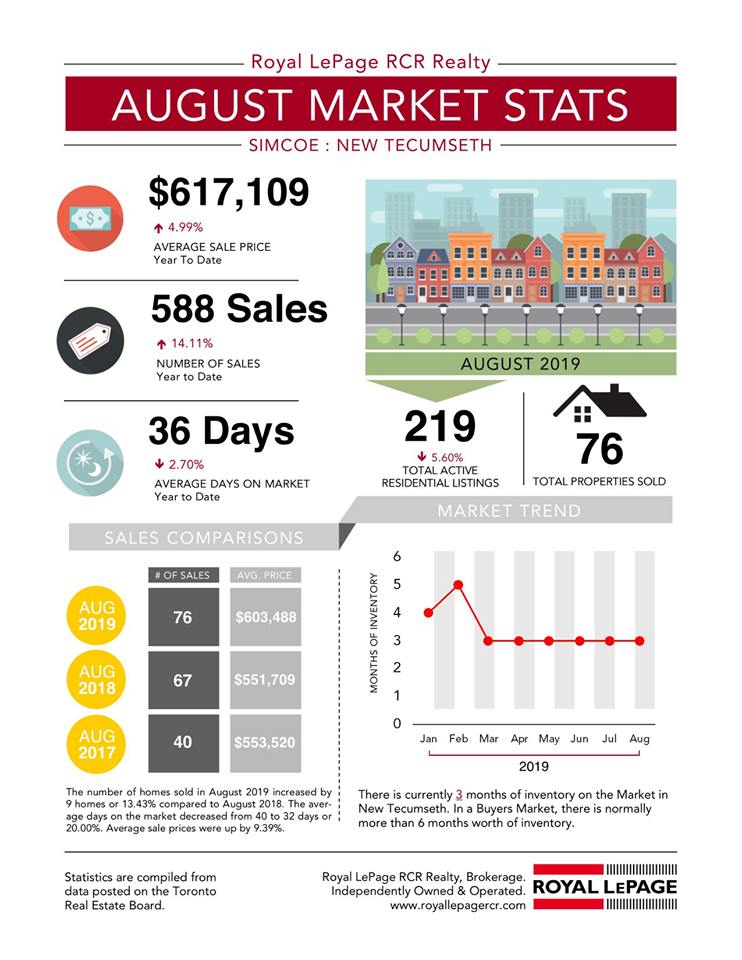
Year to Date 2019 vs. Year to Date 2018
The number of homes listed in New Tecumseth, year-to-date decreased by 2 homes or 0.19%. The number of homes sold increased by 69 homes or 14.11%. The average days on the market decreased by 1 day, from 37 days to 36 days. Average sale prices were up year over year by 4.99%.
Call me to discuss your home buying or selling needs.
Jeff Belisowski
Sales Representative
iPro Realty Ltd., Brokerage
Cell: 647-992-6262
Email: jeff@jeffbelisowskicom.staging.wpmudev.host
Website: www.jeffbelisowski.com
Not intended to solicit properties currently listed for sale or buyers under contract.
View historical data for:
- July 2019
- June 2019
- May 2019
- April 2019
- March 2019
- February 2019
- January 2019
- December 2018
- November 2018
- October 2018
- September 2018
- August 2018
- July 2018
- June 2018
- April 2018
- March 2018
- February 2018
- January 2018
- December 2017
If you have any questions about the statistics or want to discuss your real estate needs, let’s set up a time to chat.
Jeff Belisowski
Sales Representative
iPro Realty Ltd., Brokerage
Cell: 647-992-6262
Email: jeff@jeffbelisowskicom.staging.wpmudev.host
Website: www.jeffbelisowski.com
properties currently listed for sale or buyers under contract.
#realestate #realestatetips #realestateadvice
#realestatebolton #bolton #caledon