The Toronto Real Estate Board (TREB) has published the April 2019 Housing Market Statistics. From the compiled data posted I would like to show you some highlights from Caledon, Toronto West, and Simcoe.
Peel: Caledon Market Market Statistics

Market Statistics for Peel, Caledon Real Estate April 2019
Toronto West Market Statistics
The average sale price in Toronto West for April 2019 was $763,340 (YTD) that number is up by 1.24% over April 2018. The number of sales year-to-date was 2555 an increase of 1.83%. The average days on the market, year-to-date is 20 days that is down by 4.76%.
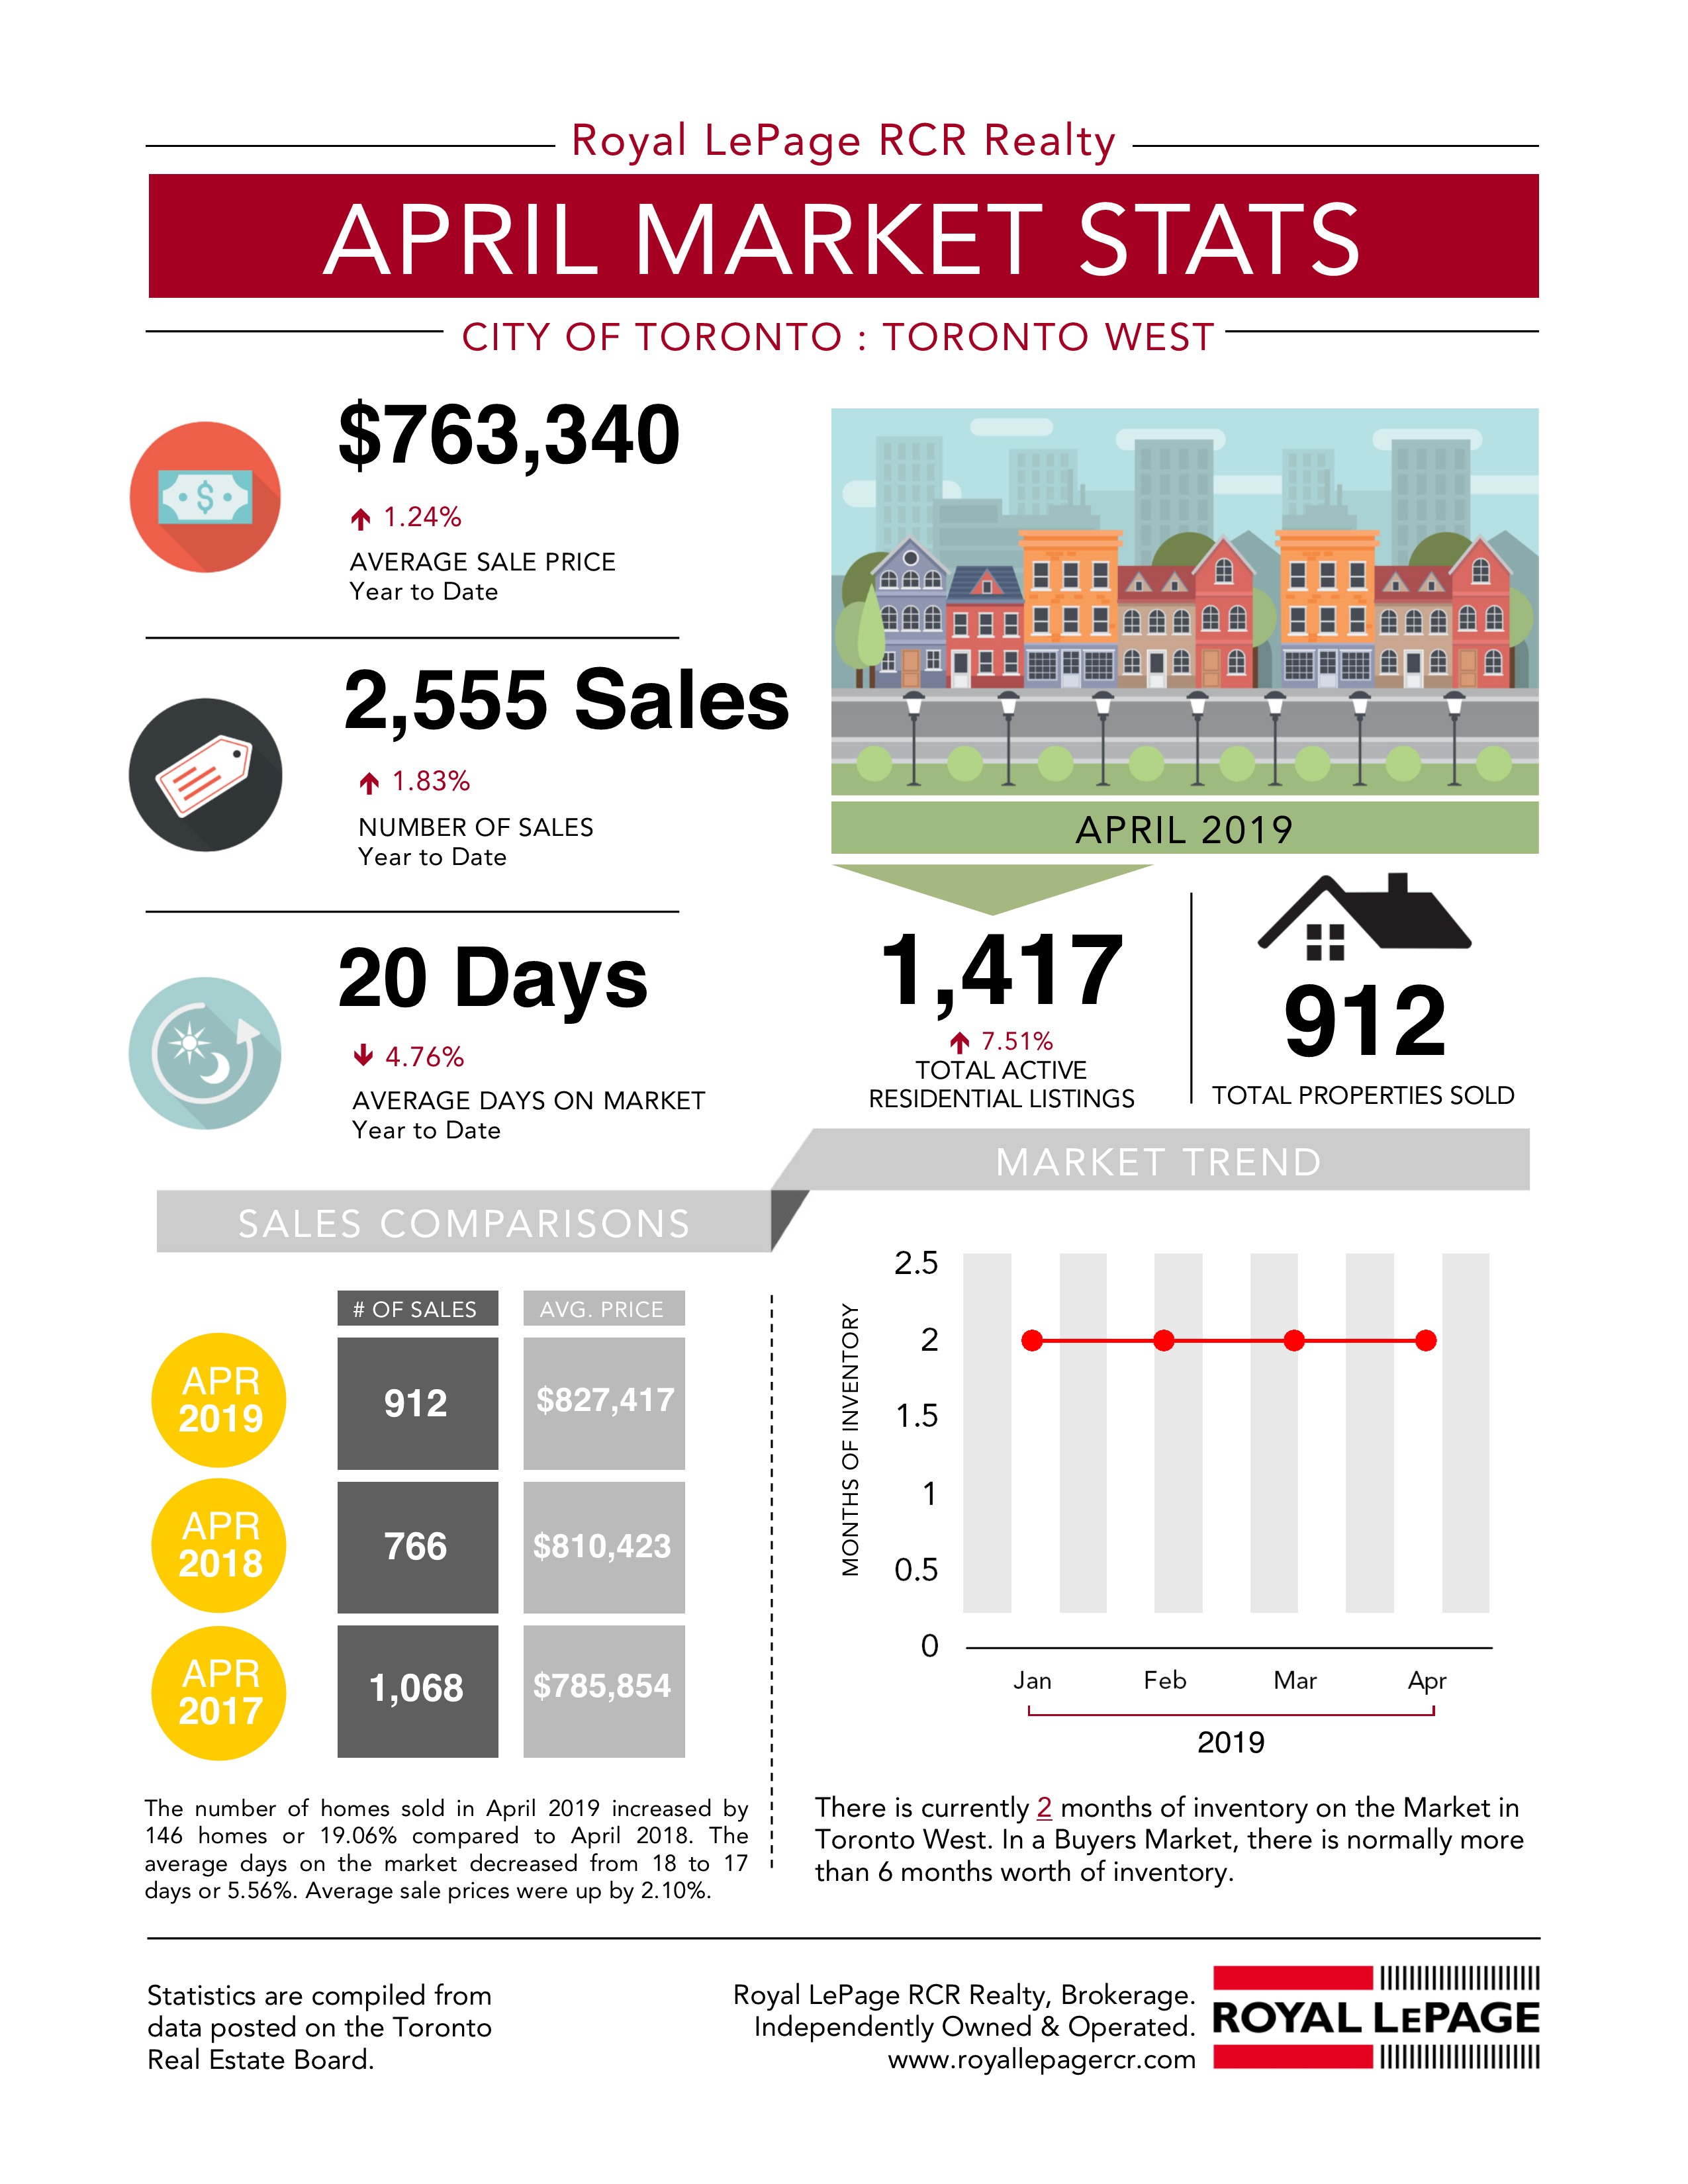
Year to Date 2019 vs. Year to Date 2018
The number of homes sold in April 2019 increased by 146 homes or 19.06%. The average days on the market decreased from 18 to 17 days or 5.56%. Average sale prices were up by 2.10%.
New Tecumseth Market Statistics
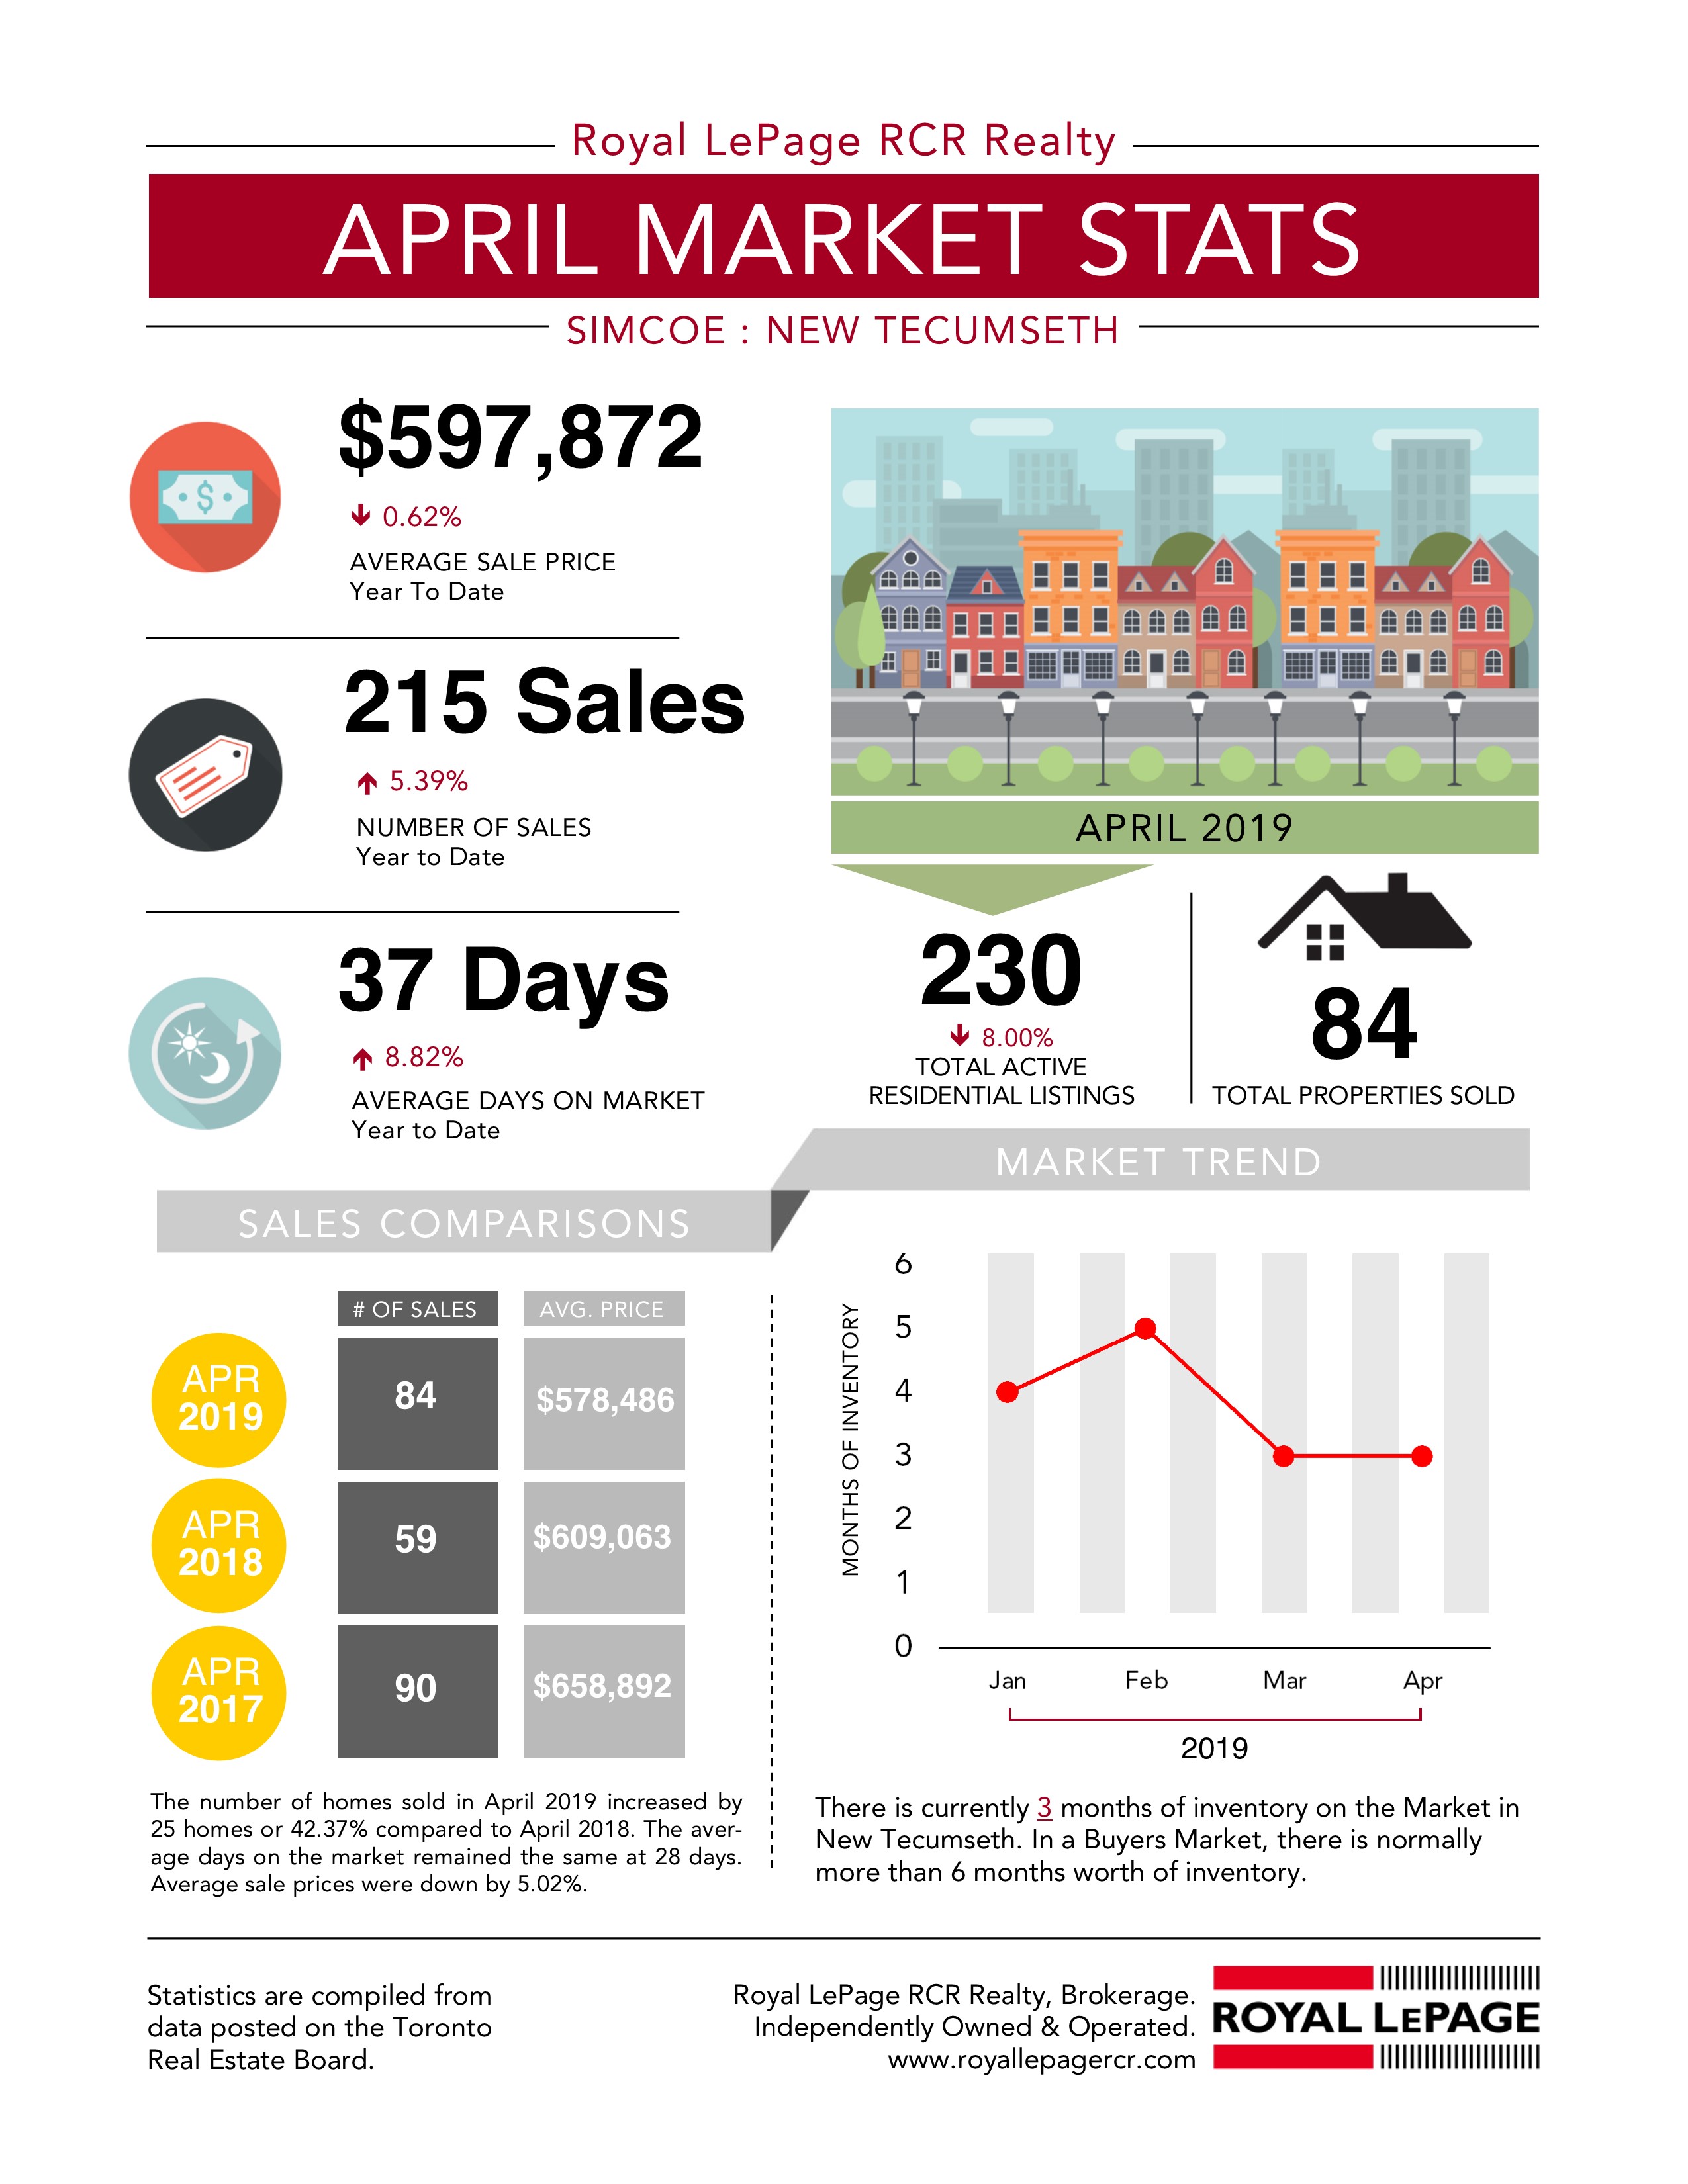
Market Statistics for Simcoe – New Tecumseth April 2019
Happy to chat about these market statistics and your specific real estate needs anytime. Call me.
Jeff Belisowski
Sales Representative
iPro Realty Ltd., Brokerage
Cell: 647-992-6262
Email: jeff@jeffbelisowskicom.staging.wpmudev.host
Website: www.jeffbelisowski.com
Not intended to solicit properties currently listed for sale or buyers under contract.
I’m happy to share more stats with you, give me a call and we can set up a time to chat.
View historical data for:
- March 2019
- February 2019
- January 2019
- December 2018
- November 2018
- October 2018
- September 2018
- August 2018
- July 2018
- June 2018
- April 2018
- March 2018
- February 2018
- January 2018
- December 2017
If you have any questions about the statistics or want to discuss your real estate needs, let’s set up a time to chat.
Jeff Belisowski
Sales Representative
iPro Realty Ltd., Brokerage
Cell: 647-992-6262
Email: jeff@jeffbelisowskicom.staging.wpmudev.host
Website: www.jeffbelisowski.com
Not intended to solicit properties currently listed for sale or buyers under contract.
#realestate #realestatetips #realestateadvice
#realestatebolton #bolton #caledon