The Toronto Real Estate Board (TREB) has published the March 2019 Housing Market Statistics. From the compiled data posted I would like to show you some highlights from Caledon & Toronto West.
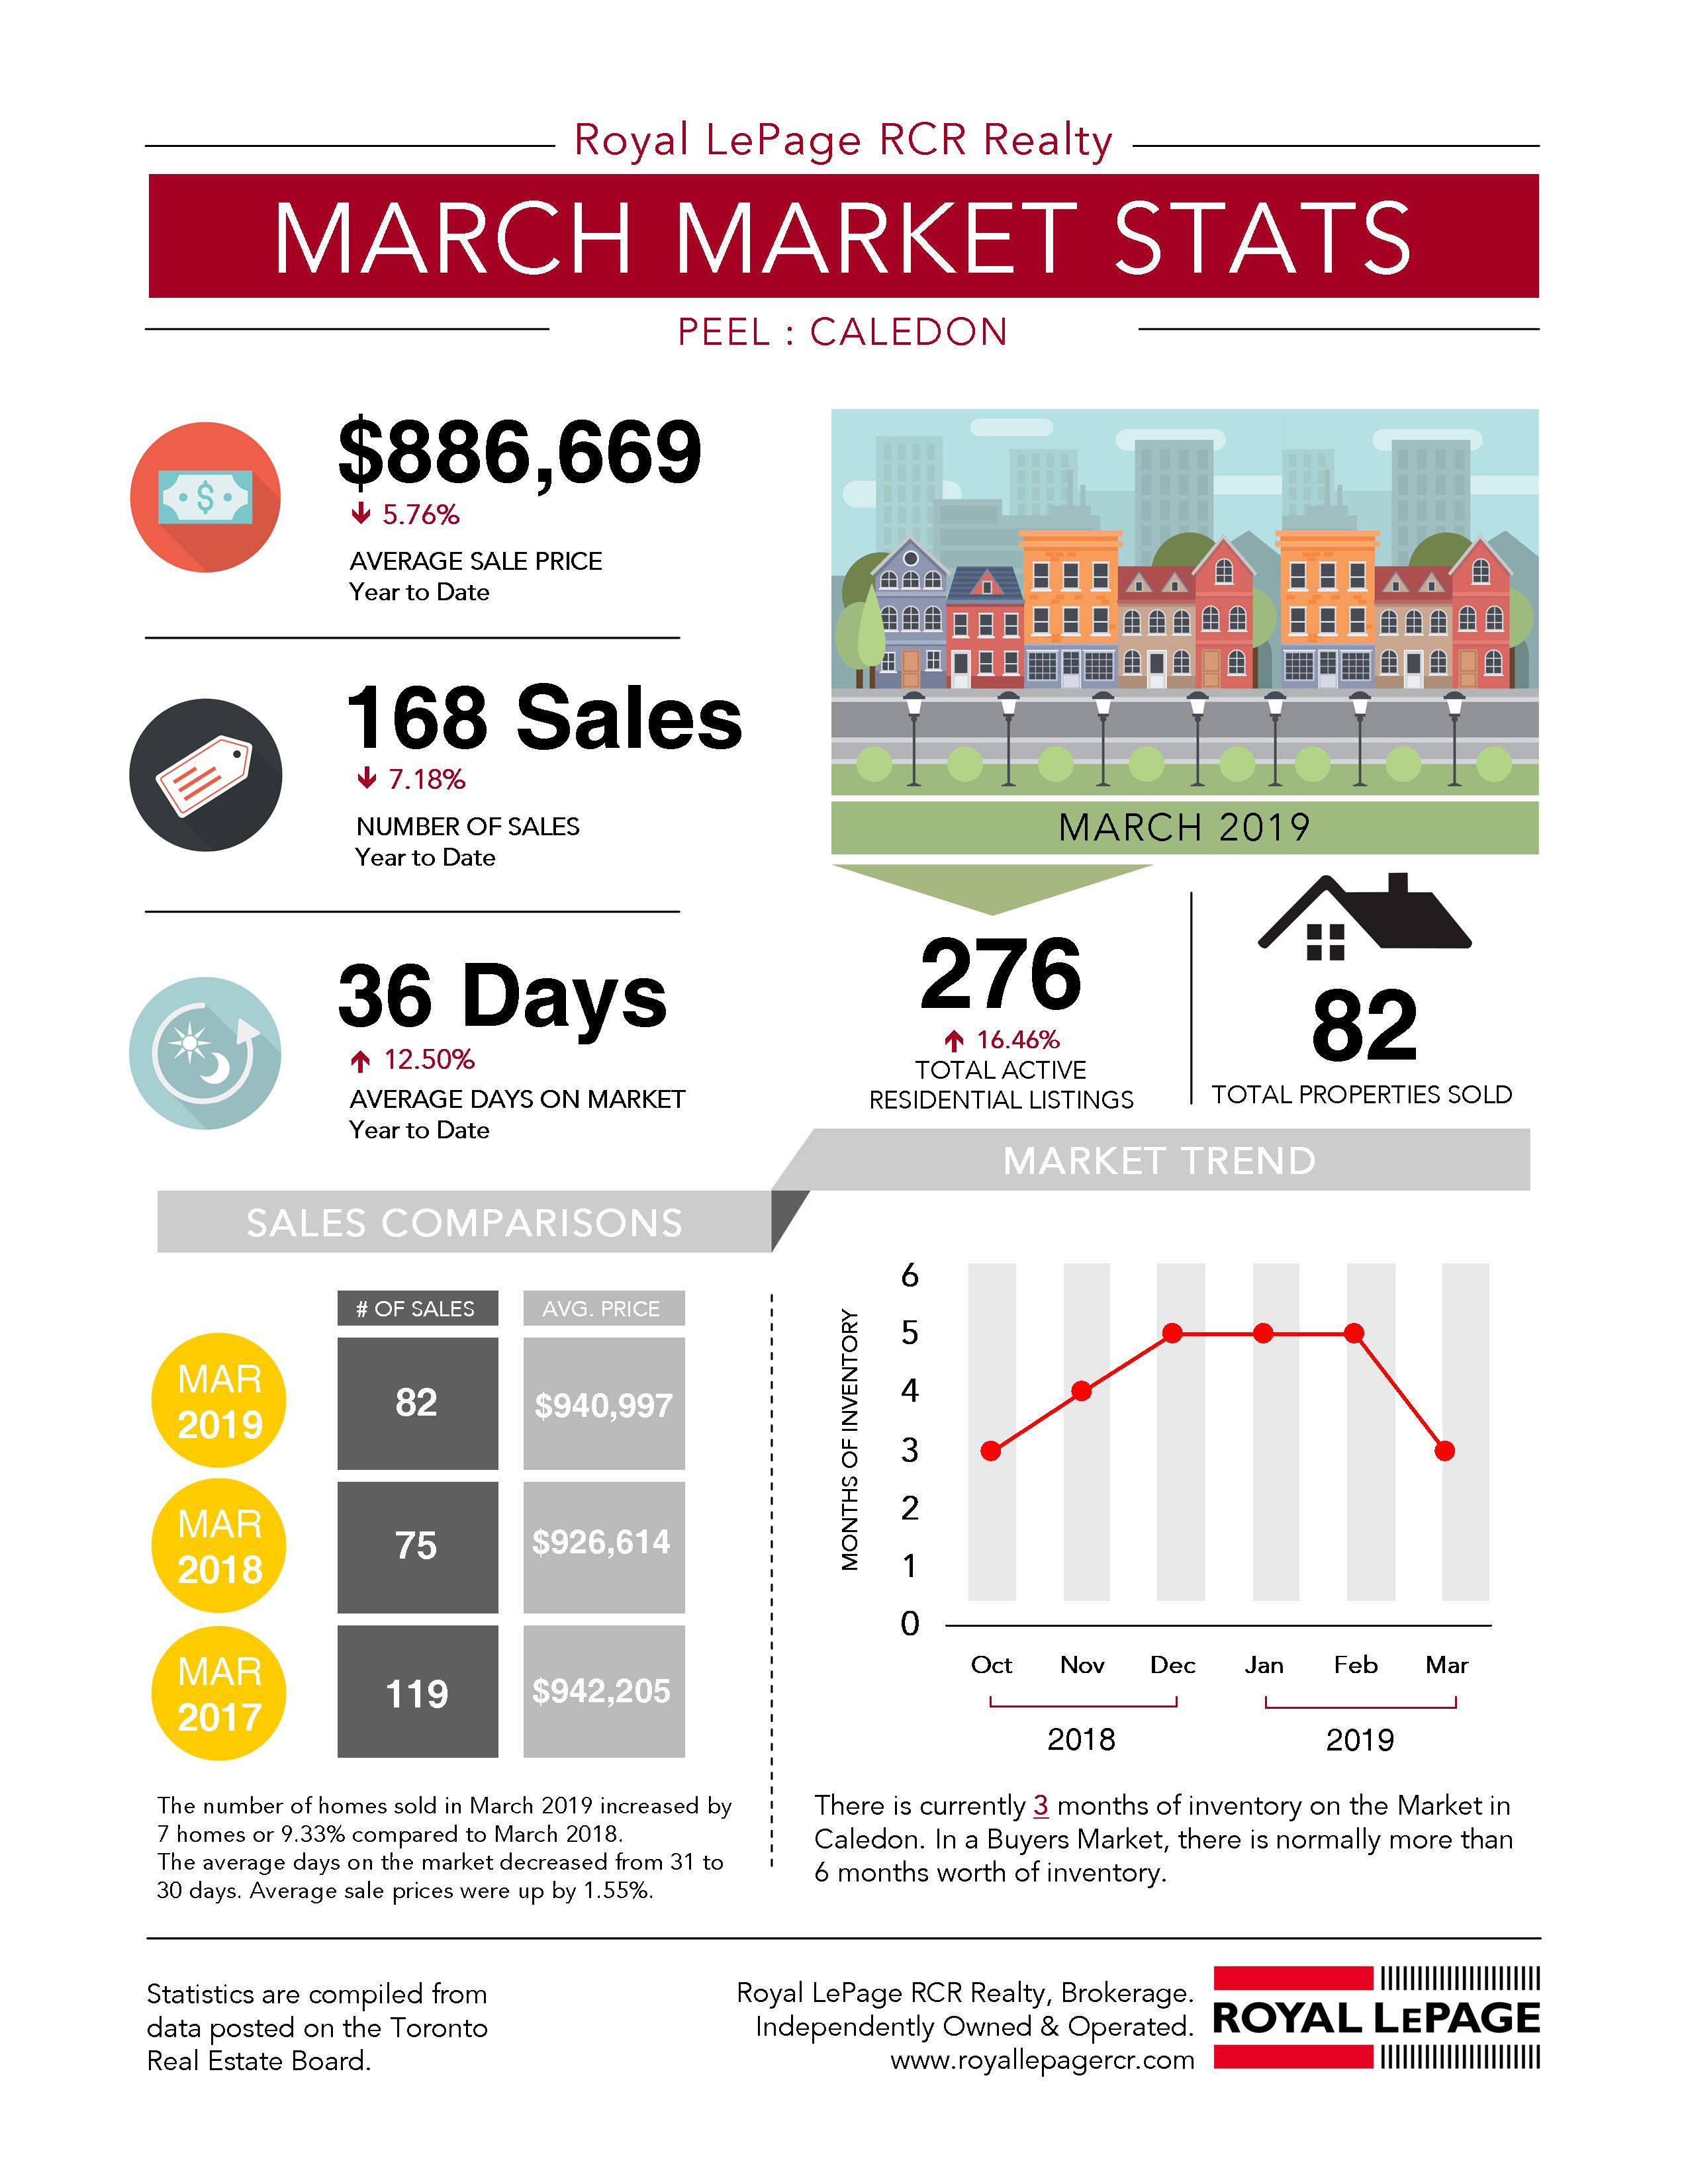
Peel: Caledon Market Highlights
- The number of active listings in Caledon increased by 16.46% in March 2019 over the same month in 2018.
- The number of listings that came on the Toronto Board in March 2019 vs. March 2018 increased by 27 homes or 16.46%.
- The number of homes sold increased by 7 homes or 9.33%.
- The average days on the market decreased by 1 day. Average sale prices were up by 1.55%.
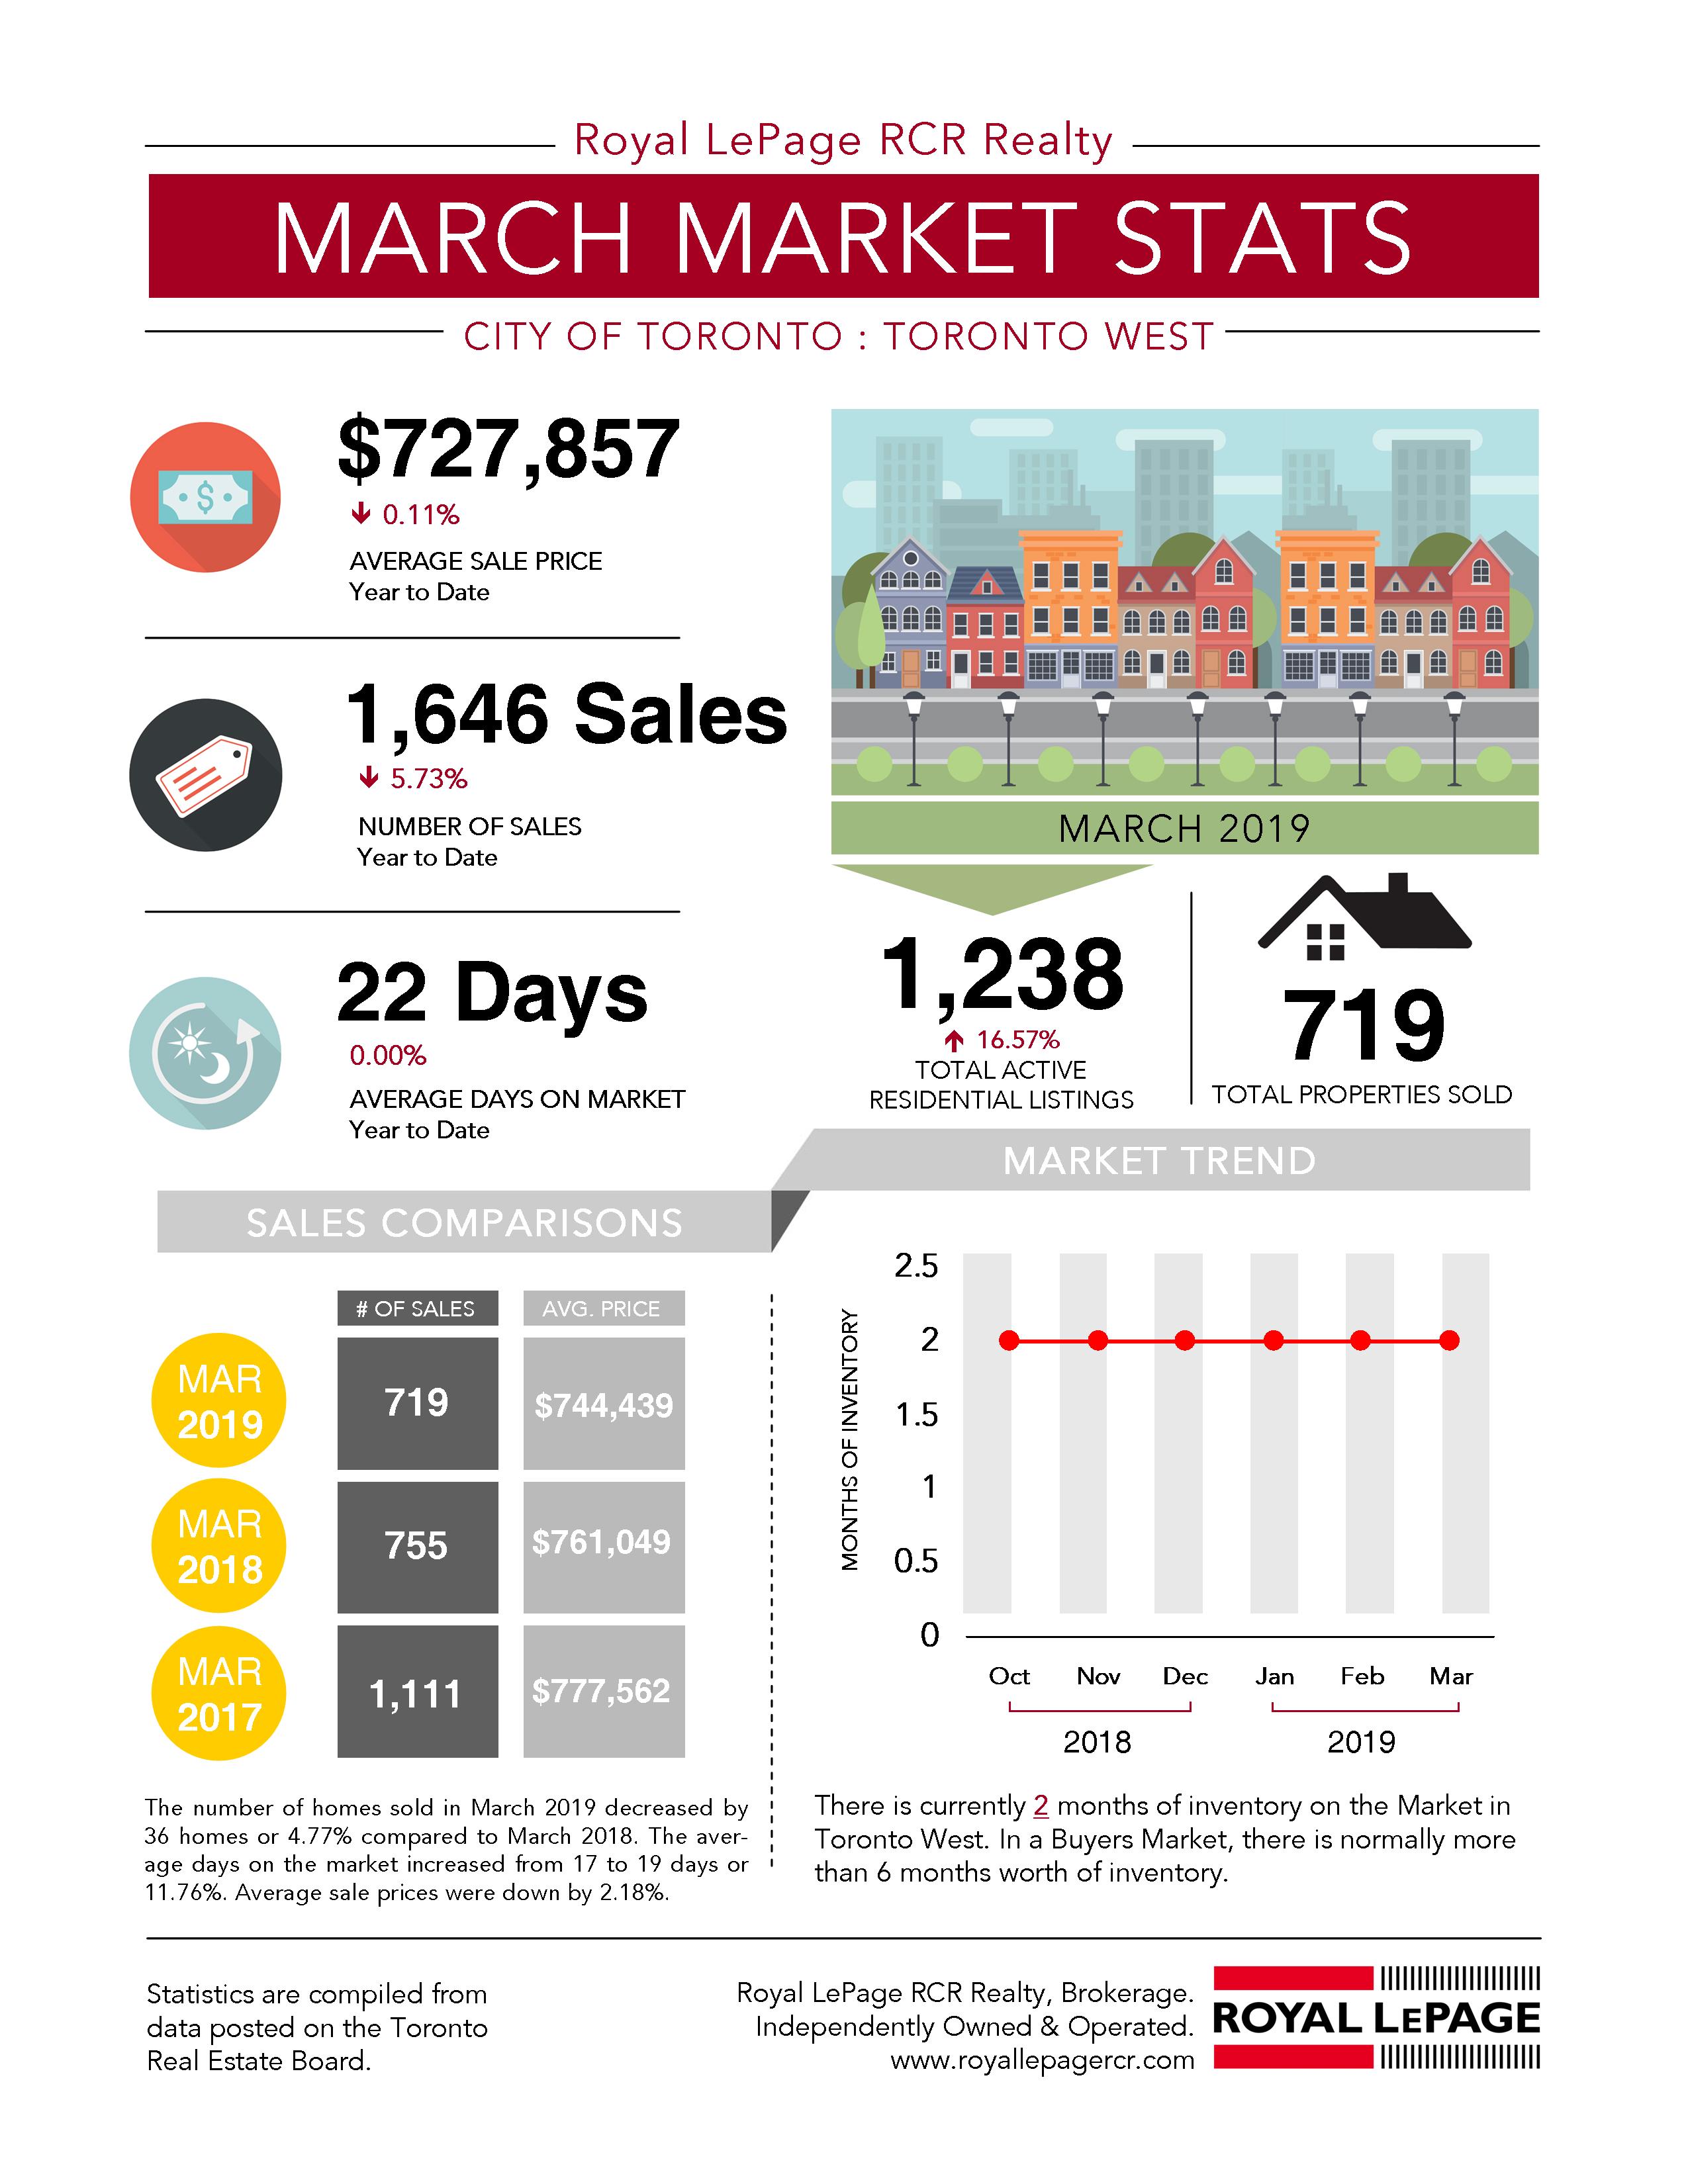
Highlights for Toronto West
Here are some highlights for the Toronto West housing market for March 2019:
- The average sale price year to date is $727,857 down .11%.
- The number of sales year-to-date is 1646 down 5.73%.
- The average number of days on the market is 22 days.
- 719 properties sold in the month of March.
- Total active residential listings went up by 16.5% to 1238.
Lastly, there are currently two months of inventory on the market in Toronto West. The buyers market there’s normally more than six months of inventory.
I’m happy to share more stats with you, give me a call and we can set up a time to chat.
View historical data for:
- February 2019
- January 2019
- December 2018
- November 2018
- October 2018
- September 2018
- August 2018
- July 2018
- June 2018
- April 2018
- March 2018
- February 2018
- January 2018
- December 2017
If you have any questions about the statistics or want to discuss your real estate needs, let’s set up a time to chat.
Jeff Belisowski
Sales Representative
iPro Realty Ltd., Brokerage
Cell: 647-992-6262
Email: jeff@jeffbelisowskicom.staging.wpmudev.host
Website: www.jeffbelisowski.com
Not intended to solicit properties currently listed for sale or buyers under contract.
#realestate #realestatetips #realestateadvice
#realestatebolton #bolton #caledon